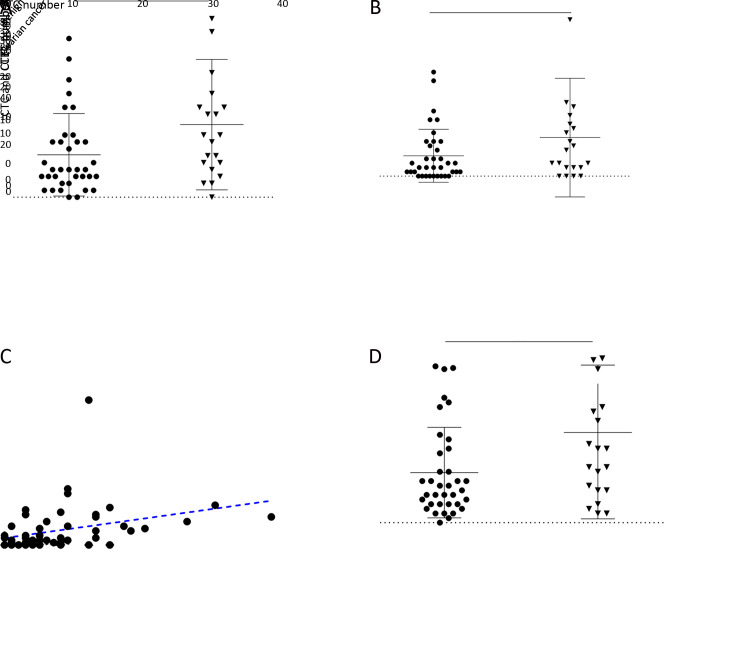
Figure 3.
Distribution of CTCs and CTECs in different groups. (A) Total CTCs counts in ovarian cancer patients and benign tumor patients (P=0.0351); (B) Total CTECs counts in ovarian cancer patients and benign tumor patients (P=0.1652); (C) Correlation between dynamics changes in CTC and CTEC (r=0.442, P=0.0010); (D) Sum of CTCs and CTECs in ovarian cancer patients and benign tumor patients (P=0.0647). CTC, circulating tumor cell; CTEC, circulating tumorigenic endothelial cell; *, P<0.05; ns, no significance.

