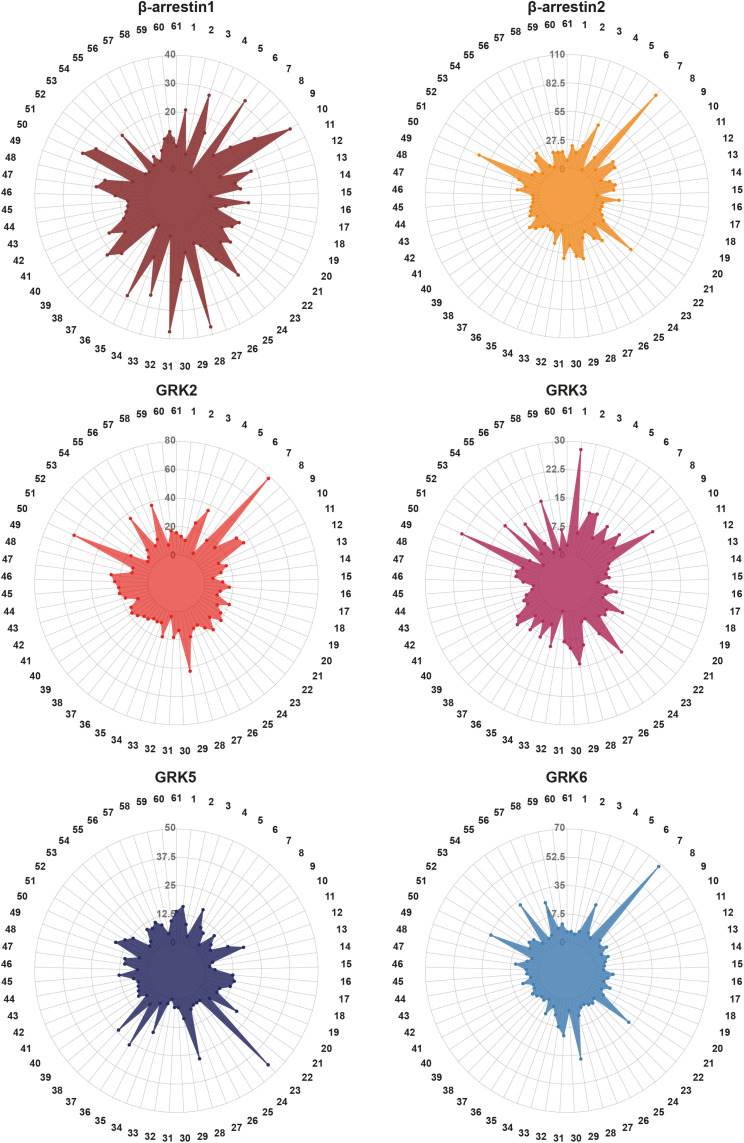
FIGURE 3.
Visualization of the tissue-specific expression levels of GRK2, 3, 5, and 6, β-arrestin1 and -2. The consensus expression data of Table 1 are visualized in radar plots for each protein in 61 tissues. The numbers correspond to the assigned indices of tissues in Table 1. The data are based on the Human Protein Atlas version 20.1 (https://www.proteinatlas.org/), last accessed March 10th, 2021.

