FIGURE 4.
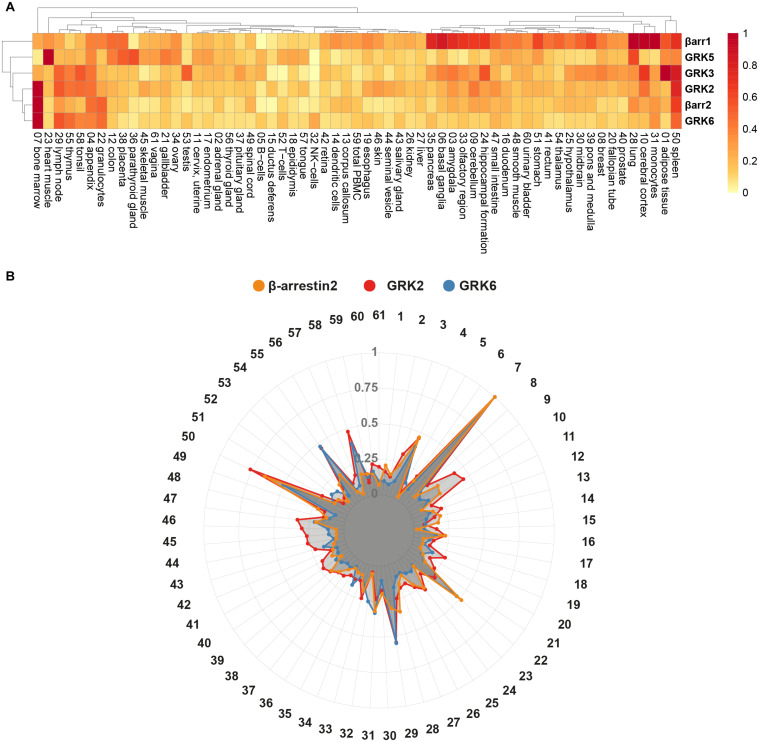
Clustering of relative protein expression and overlay of GRK2, GRK6, and β-arrestin2 tissue expression. (A) Clustering of relative expression profiles of GRK2, 3, 5, 6, and β-arrestin1 and 2, according to Euclidean distance. The NX values of Table 1 were normalized to the respective maximal tissue expression for each protein. The clustering heatmap was generated using the pheatmap R package (Kolde (2013). pheatmap: Pretty Heatmaps. R package version 1.0.12, http://CRAN.R-project.org/package=pheatmap). (B) Relative tissue expression of GRK2 (red), GRK6 (blue), and β-arrestin2 (yellow) are shown together. The data are based on the Human Protein Atlas version 20.1 (https://www.proteinatlas.org/), last accessed March 10th, 2021.

