
FIGURE 1.
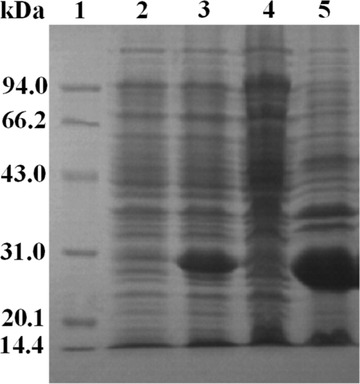
SDS‐PAGE analysis of the cell culture. Lane 1, standard marker; Lane 2, the culture without IPTG induction; Lane 3, the culture with IPTG induction; Lane 4, the supernatant; Lane 5, the inclusion bodies
Official websites use .gov
A
.gov website belongs to an official
government organization in the United States.
Secure .gov websites use HTTPS
A lock (
) or https:// means you've safely
connected to the .gov website. Share sensitive
information only on official, secure websites.
SDS‐PAGE analysis of the cell culture. Lane 1, standard marker; Lane 2, the culture without IPTG induction; Lane 3, the culture with IPTG induction; Lane 4, the supernatant; Lane 5, the inclusion bodies