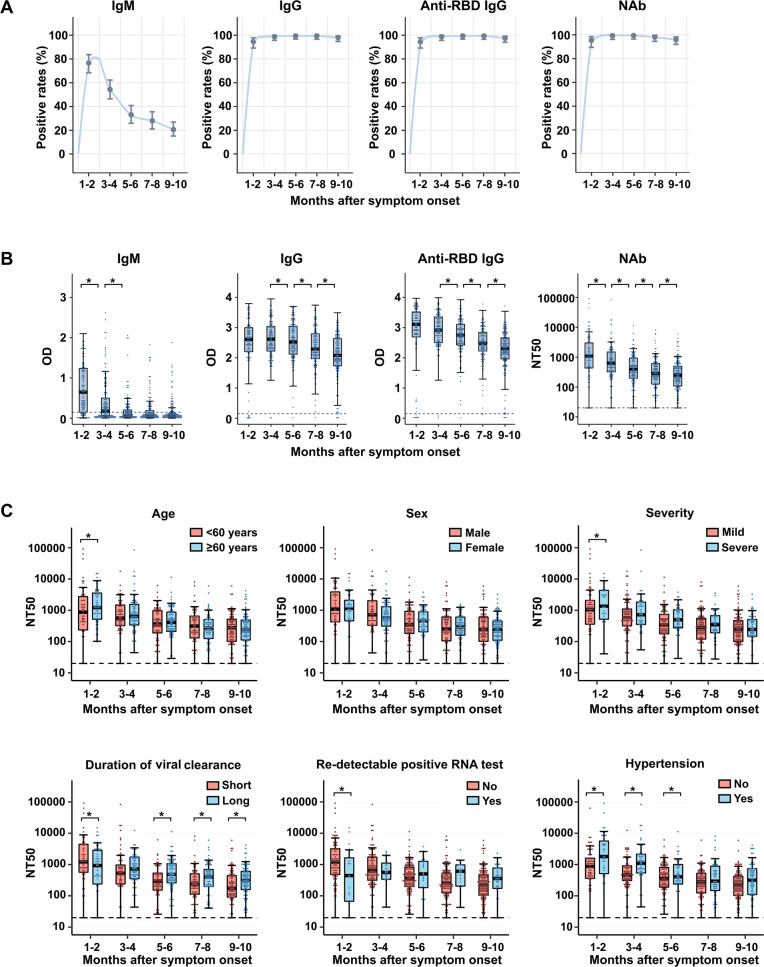
Fig. 1.
Longitudinal assessment of the antibody response to SARS-CoV-2. A Positivity rates for virus-specific IgM, IgG, anti-RBD IgG, and NAb. An optical density (OD) value of 0.15 indicated positivity for IgM, IgG, and anti-RBD IgG; the cutoff for NAb was NT50 of 20. B Box plots show the distribution of IgM, IgG, anti-RBD IgG, and NAb titers over time. Boxplots show the 25th, 50th (median), and 75th percentiles. Whiskers extend to the upper and lower adjacent values, with the farthest values within 1.5 × the interquartile range beyond the 25th and 75th percentiles. The dashed lines of IgM, IgG, and anti-RBD IgG indicate the thresholds for a test to be declared positive. The dashed lines of neutralizing antibodies indicate the limit of detection for the pseudotyped virus neutralization assay. We used linear mixed models to estimate the difference between different phases after symptom onset, which was adjusted for age and sex. All P values were calculated based on multivariate linear mixed models. C Box plots illustrate the distribution of NAb titers by age, sex, severity, duration of viral clearance, redetectable positive RNA test, and history of hypertension, along with the median (solid horizontal line in the box) and quartile (upper/lower limits of the box). We used linear mixed models and constructed Wald tests to derive P values comparing different subgroups, which were adjusted for age and sex. NAb neutralizing antibody, OD optic density, NT50 half-maximal inhibitory concentration for plasma. *P value < 0.05

