Fig. 1.
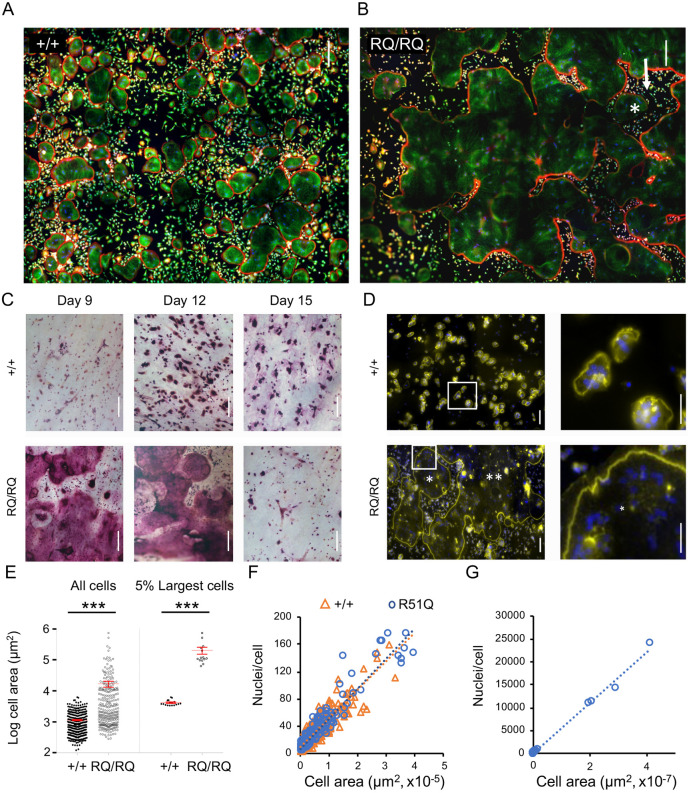
R51Q SNX10 OCLs are gigantic. (A,B) Spleen-derived OCLs from +/+ (A) and RQ/RQ (B) mice grown on glass coverslips. Each image is a composite of 12 smaller fields; most of the RQ/RQ image is occupied by part of a single OCL. Cells were stained for actin (red), tubulin (green) and DNA (blue). Boundaries of individual OCLs are marked in Fig. S1C,D. Arrow in B indicates external area that is completely surrounded by the cell, and which contains an OCL (asterisk). (C) Spleen-derived OCLs from +/+ and RQ/RQ mice were grown on bone for the indicated periods, followed by TRAP staining. Figures represent four +/+ and nine RQ/RQ mice from three experiments. RQ/RQ image at day 12 is a composite of two identical images captured at different focal planes. (D) Cells grown on bone were stained for actin (yellow, SZs) and for DNA (blue, nuclei). Most of the RQ/RQ image is occupied by two giant cells that are marked with one or two asterisks, respectively. Each figure is a composite of 15 smaller fields. Right panels show magnified views of boxed areas in the left panels; asterisk (RQ/RQ image) indicates a region within a single OCL. Figures represent three mice/genotype analyzed in two experiments. (E) Size distribution of spleen-derived OCLs grown on bone and stained for TRAP. The left plot shows the average size (mean±s.d.) of multinucleated (≥three nuclei) OCLs shown is 1151±54 µm2 (+/+; N=353 cells) versus 16,892±3682 µm2 (RQ/RQ; N=280 cells). The right plot shows the average sizes of the largest 5% of OCLs were 4207±217 µm2 (+/+; N=17 cells) versus 206,175±52,323 µm2 (RQ/RQ; N=14 cells). ***P<0.0001 (unpaired two-tailed Student's t-test). The y-axis scale is logarithmic. Data are from one mouse per genotype, and represent four similar experiments with cells grown on bone or plastic. (F) Scatter diagram depicting the number of nuclei and area per cell in RQ/RQ and +/+ OCLs (N=205, 544 cells, respectively) of similar size ranges. Linear trendlines for both genotypes overlap (R2: +/+=0.8143, RQ/RQ=0.9095). Data are from one +/+ mouse and two RQ/RQ mice. (G) Similar to F, showing RQ/RQ OCLs of all size ranges. N=219 RQ/RQ OCLs, R2=0.9951. The large group of cells at the lower left is the same one shown in F. In panels D-G, cells were analyzed at their prime (day 8 for RQ/RQ OCLs, and day 12 for +/+ OCLs, owing to the faster development of the mutant cells). Scale bars: 200 µm (A-C); 100 µm (D, left panels); 50 µm (D, right panels).

