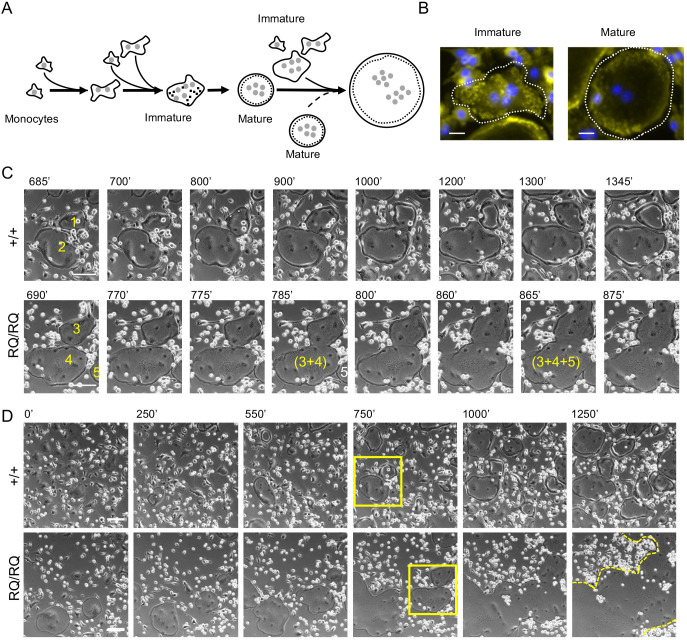
Fig. 2.
RQ/RQ OCLs are large due to deregulated fusion. (A) Schematic outline of osteoclastogenesis as monocytes develop into OCLs when cultured with M-CSF and RANKL, based on live cell imaging studies. Small shaded circles, nuclei; black dots, podosomes; dashed circular lines, the podosomal SZL structure. Dashed arrow highlights fusion between two mature round OCLs, which is detected only in RQ/RQ cultures. (B) Immature (left) and mature (right) +/+ OCLs. Cells were stained for actin (podosomes, yellow) and DNA (nuclei, blue). Dashed white line indicates cell boundaries. (C) Image series showing mature round +/+ OCLs interacting for 660 min without fusing (cells 1 and 2, Movie 1), versus two rapid fusion events between mature RQ/RQ OCLs that occur during 175 min (cells 3, 4 and 5; from Movie 2). Small bright cells are monocytes. Numbers indicate individual cells; parentheses indicate fused cells. (D) Lower magnification images showing fusion of +/+ (from Movie 1) and RQ/RQ (Movie 2) OCLs. Rectangles indicate areas enlarged in C. Dashed line in RQ/RQ culture, t=1250 min, marks outline of a single large OCL. Composite movies of larger field views of OCL fusion are presented as Movies 3 (+/+) and 4 (RQ/RQ). Scale bars: 20 µm (B); 100 µm (C,D).

