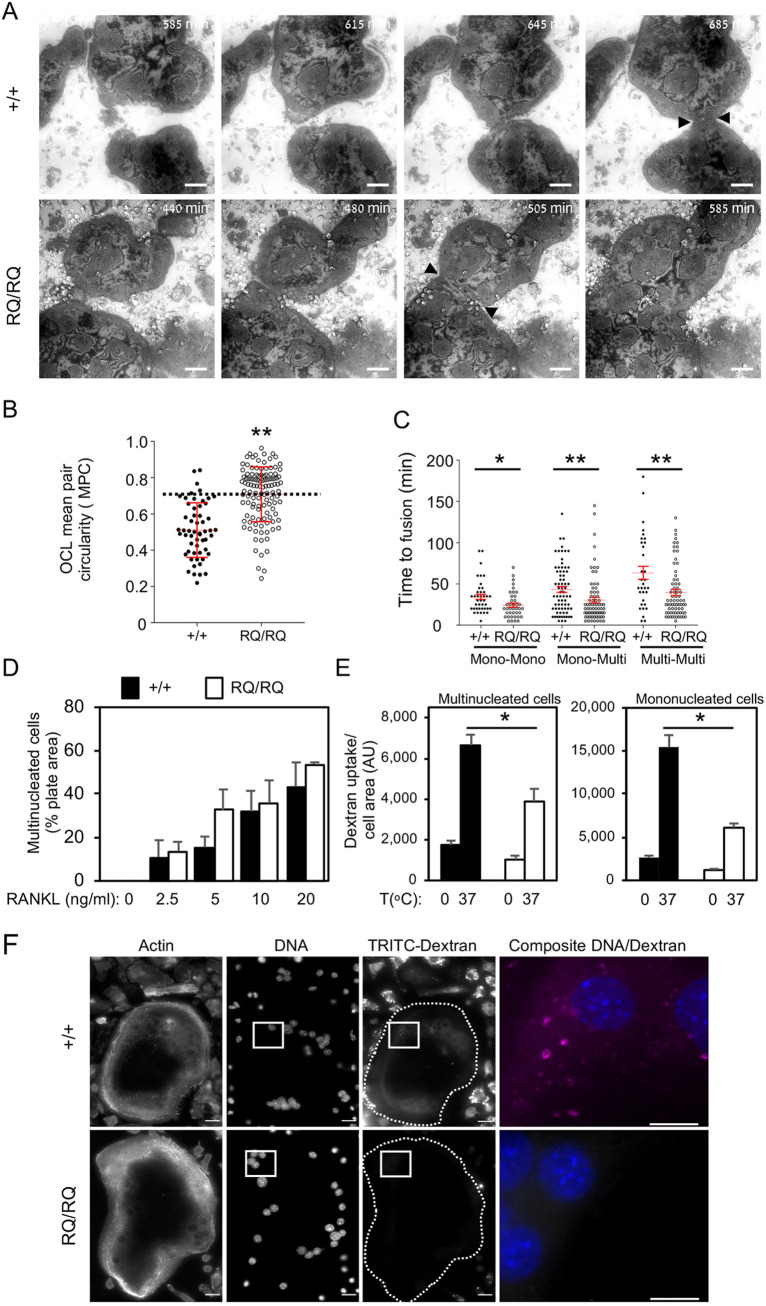
Fig. 3.
Fusion dynamics of homozygous R51Q SNX10 OCLs. (A) Images captured from IRM movies showing fusion of +/+ and RQ/RQ OCLs at the indicated times (from Movies 5 and 6, respectively). Arrowheads mark the area of contact between +/+ cells (top, t=685 min) and fusion between RQ/RQ cells (bottom, t=505 min). See also Figs S2, S3. (B) Scatter plot showing the MPC of pairs of multinucleated +/+ and RQ/RQ OCLs that fused, from Movies 3 and 4. Horizontal dashed line indicates MPC=0.7. MPC values (mean±s.d.) are 0.511±0.150 (+/+) and 0.708±0.151 (RQ/RQ), N=56 and 117 cell pairs, respectively. **P<0.0001 (unpaired two-tailed Student's t-test). (C) Elapsed time between initial cell-cell contact and subsequent fusion. Mono, mononucleated monocytes; Multi, multinucleated OCLs. Data are mean±s.e., N=31-73 fusion events per category and genotype. Data are from N=3 +/+ and 3 RQ/RQ mice from three experiments. *P=0.017, **P<0.0085 (unpaired two-tailed Student's t-test). (D) Percentage of the well surface area covered by +/+ and RQ/RQ OCLs differentiated with RANKL for 5 days (mean±s.e., N=3 mice/genotype in three experiments). OCL images are presented in Fig. S4A. (E) Uptake of dextran by +/+ and RQ OCLs (left) and mononucleated cells (right) following incubation for 30 min at 0 or 37°C in the presence of TRITC-dextran (40 kDa). Fluorescence images were acquired at identical settings for all conditions. Shown is the total TRITC fluorescence per cell normalized by cell area (mean±s.e.): *P≤0.0002 by one-way ANOVA with Tukey-Kramer post-hoc analysis. N=29-32 (+/+ multinucleated) and 11-13 (RQ/RQ multinucleated) or 59-64 (+/+ mononucleated) and 39-56 (RQ/RQ mononucleated) cells/bar from two experiments. Dextran uptake at 0°C and cell size ranges were similar in both genotypes. (F) Images of mature +/+ and RQ/RQ OCLs that had been incubated with TRITC-dextran for 30 min at 37°C. Dashed lines indicate cell boundaries. Scale bars: 100 µm (A); 20 µm (F); 10 µm (F, composite image at the far right). AU, arbitrary units.

