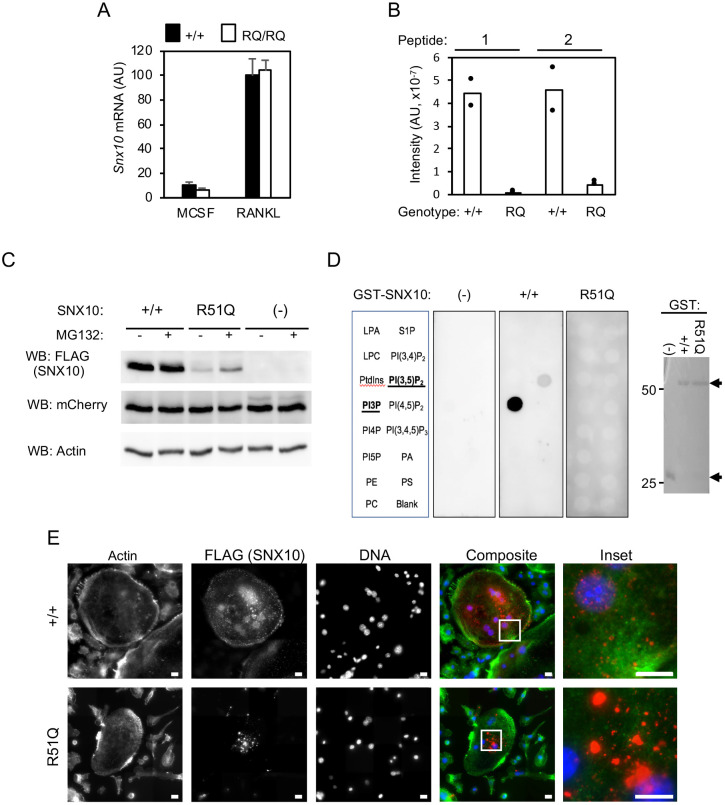
Fig. 4.
Mislocalization, reduced stability and reduced lipid-binding ability of R51Q SNX10 in RQ/RQ OCLs. (A) qPCR analysis of Snx10 mRNA expression (mean±s.d.) in +/+ and RQ/RQ monocytes/macrophages (M-CSF) or OCLs produced from them (RANKL). N=12 +/+ and 14 RQ/RQ mice. (B) Targeted proteomics of +/+ and RQ/RQ OCL lysates. Two peptides (peptide 1, LQSNALLVQLPELPSK; and peptide 2, NLFFNMNNR, starting at residues 64 and 80, respectively, in the SNX10 sequence) were detected and quantified. N=2 mice/genotype. (C) RAW264.7 cells were infected with lentiviral vectors expressing FLAG-tagged wild-type (+/+) or R51Q SNX10, or were empty (−). Some cells were treated with 20 nM MG-132 for 4 h before processing. mCherry protein, which is co-expressed from the same lentiviral constructs, and actin serve as infection/expression and loading controls, respectively. (D) In the left panels, equal amounts of GST fusion proteins of +/+ or R51Q SNX10 were used to probe membrane phospholipid arrays. (−), negative control (GST alone). Array incudes lysophosphatidic acid (LPA), lysophosphocholine (LPC), phosphatidylinositol (PtdIns), PtdIns (3) phosphate (PI3P), PtdIns (4) phosphate (PI4P), PtdIns (5) phosphate (PI5P), phosphatidylethanolamine (PE), phosphatidylcholine (PC), sphingosine 1-phosphate (S1P), PtdIns (3,4) bisphosphate [PI(3,4)P2], PtdIns (3,5) bisphosphate [PI(3,5)P2], PtdIns (4,5) bisphosphate [PI(4,5)P2], PtdIns (3,4,5) trisphosphate [PI(3,4,5)P3], phosphatidic acid (PA) and phosphatidylserine (PS). The right panel shows a Coomassie-stained protein gel documenting the amounts of GST proteins used to probe the arrays. One experiment out of two performed is shown. Arrows mark GST-SNX10 (top) and GST (bottom). (E) Localization of wild-type and mutant SNX10 in OCLs. cDNA for +/+ SNX10 bearing a C-terminal FLAG tag was expressed in wild-type OCLs by adenoviral transduction; a tagged cDNA for R51Q SNX10 was similarly expressed in RQ/RQ OCLs, and the cells were probed for actin (green fluorescence), FLAG (SNX10, red) and DNA (blue). No FLAG signal was detected in untransduced cells (not shown). Scale bars: 10 µm. AU, arbitrary units.

