Fig. 5.
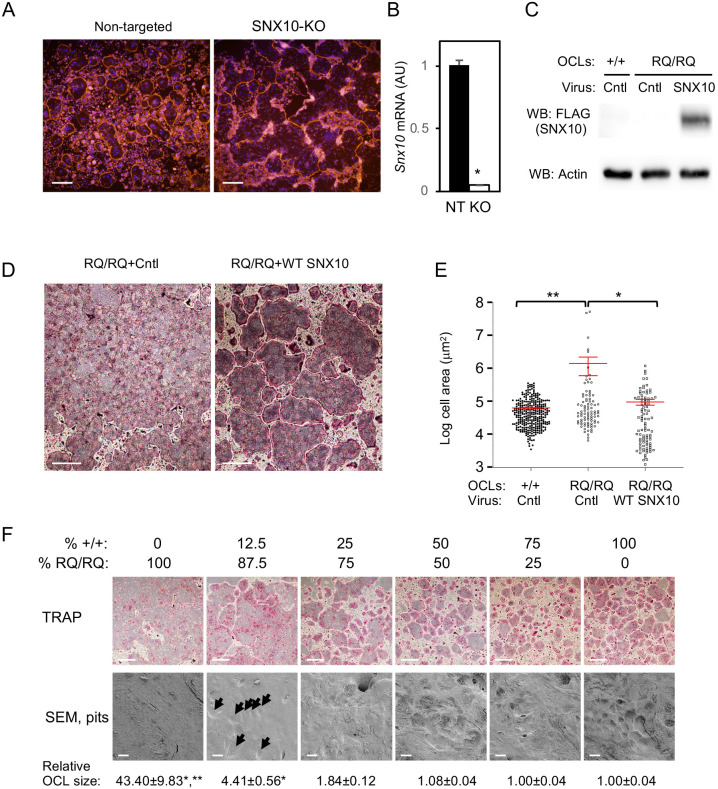
The R51Q SNX10OCL fusion phenotype is caused by loss of SNX10 function. (A) SNX10-knockout (SNX10-KO) RAW 264.7 cells and control cells treated with a non-targeting control sgRNA were seeded on plastic plates and differentiated into OCL-like cells with M-CSF and RANKL for 4 days. The cells were stained for actin (TRITC-phalloidin, red) and DNA (Blue). Individual OCL boundaries and the sequence of the mutated locus are presented in Fig. S5. Data are from one SNX10-KO clone and are representative of six independent clones. (B) qPCR analysis of Snx10 mRNA expression (mean±s.e.) in non-targeted RAW 264.7 cells (NT) and in SNX10-KO (KO) cells shown in A. P=0.00049 (unpaired two-tailed Student's t-test, N=3 repeats). (C) Protein blot documenting expression of exogenous wild-type SNX10 in RQ/RQ OCLs, for panels D and E. Cntl, control adenovirus expressing GFP. SNX10, adenovirus expressing wild-type FLAG-tagged SNX10. (D) Images of TRAP-stained RQ/RQ OCLs infected with control (+Cntl) or wild-type SNX10 (+WT SNX10) adenoviruses. (E) Areas (mean±s.e.) of OCLs infected with control or wild-type SNX10 adenoviruses, from one experiment representative of two performed. *P=0.0042, **P=0.0002 (one-way ANOVA). N=88-309 multinucleated cells/category from three experiments. The y-axis scale is logarithmic. (F) +/+ and RQ/RQ monocytes/macrophages were mixed as indicated and differentiated into OCLs on plastic (TRAP) or bone (SEM). TRAP-stained cells (top) and scanning electron microscopy (SEM) of pits excavated by the cells (bottom) are shown, as well as cell sizes (mean±s.e., relative to the culture of 100% +/+ cells). *P<0.0001 versus 100% +/+ cell culture, **P<0.0001 versus 12.5% +/+ cells (unpaired two-tailed Student's t-test). N=222-606 cells/category (100%-12.5% +/+ cells) and N=28 cells (0% +/+ cells). Arrows mark resorbed pits in the 12.5% SEM image. Images are from one experiment, representing six TRAP and two SEM experiments. Scale bars: 500 µm (A); 250 µm (D,F, TRAP); 20 µm (F, SEM). AU, arbitrary units.

