FIG. 1.
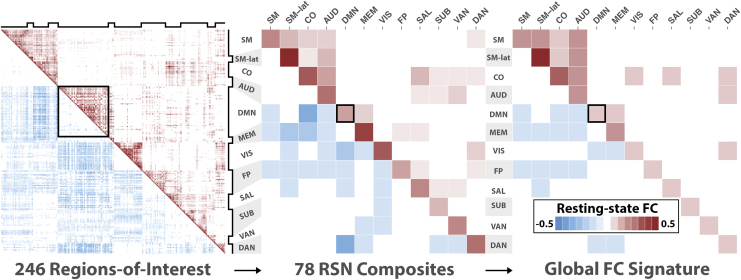
PCA reveals a distributed pattern of FC changes across cortical and subcortical RSNs. Left: The mean FC matrix across all participants. An FC matrix from 248 regions of interest was computed for each participant. Positive correlations are shown in the upper triangle, and negatives are shown in the bottom triangle. Notched black lines on the top and to the right indicate RSNs. The black box outline is a visual aid highlighting the intranetwork FC values of the DMN. Middle: The mean FC-composite matrix across all participants. For each participant, an FC-composite matrix was generated by computing the mean intra- and internetwork FC matrix values (total of 78) for all 12 RSNs. Here the black box highlights the mean intranetwork FC value of the DMN. Right: The global FC signature is derived from the primary PCA pattern and reflects positively and negatively weighted mean FC-composite values. The strongest positive weights include the SM, SMlat, CO, AUD, VIS, and MEM. The strongest negative weights included the FP, MEM, DAN, and DMN. The black box outline highlights the weight of the mean intranetwork FC value of the DMN. AUD, auditory; CO, cingulo-opercular; DAN, dorsal attention; DMN, default mode network; FC, functional connectivity; FP, frontoparietal; MEM, memory; PCA, principal component analysis; RSNs, resting-state networks; SAL, salience; SM, sensorimotor; SMlat, sensorimotor-lateral; SUB, subcortical; VAN, ventral attention; VIS, visual. Color images are available online.

