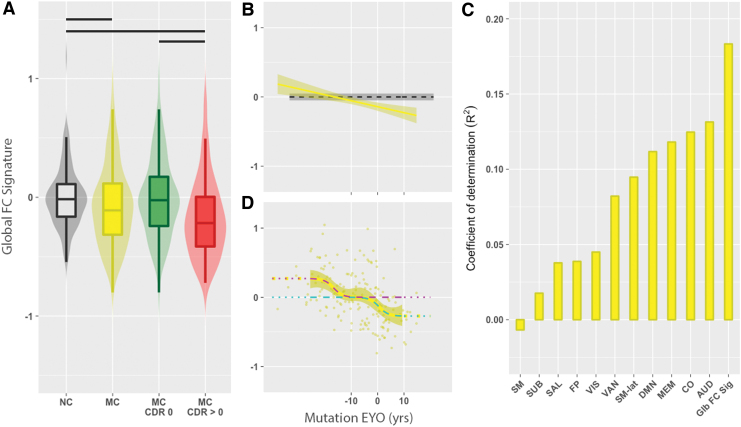
FIG. 2.
(A) The global FC signature as a function of mutation status, CDR, and EYO. (A) Violin and box plots of the global FC signature for NC (gray) and MC (yellow), MC CDR 0 (green), and MC CDR >0 (red) participants. NC had a higher global FC signature compared with MC. MC CDR >0 had significant decreases in the global FC signature compared with NC and MC CDR 0 participants. A black bar represents a significant group difference. (B) Line plot showing the association between global FC signature and mutation EYO for MC participants. The global FC signature was associated with EYO in MC (p < 0.05). The dashed line (black) is the mean global FC signature in NC participants, and the dark gray band is the confidence interval defined as two standard errors of the mean. (C) Coefficient of determination (R2) for the global FC signature and the intranetwork values of 12 RSNs. The length of the vertical bar represents the strength of that FC value for predicting EYO. (D) The global FC signature for MC individuals exhibits a biphasic behavior with regard to mutation EYO in ±5-year bins. When the global FC signature was fit to the bin means (yellow curve), two logistic curves were observed (magenta and cyan). A two-stage process was observed, with early and late changes seen in the global FC signature. CDR, clinical dementia rating; EYO, expected years to symptom onset; MC, mutation carrier; NC, noncarrier. Color images are available online.

