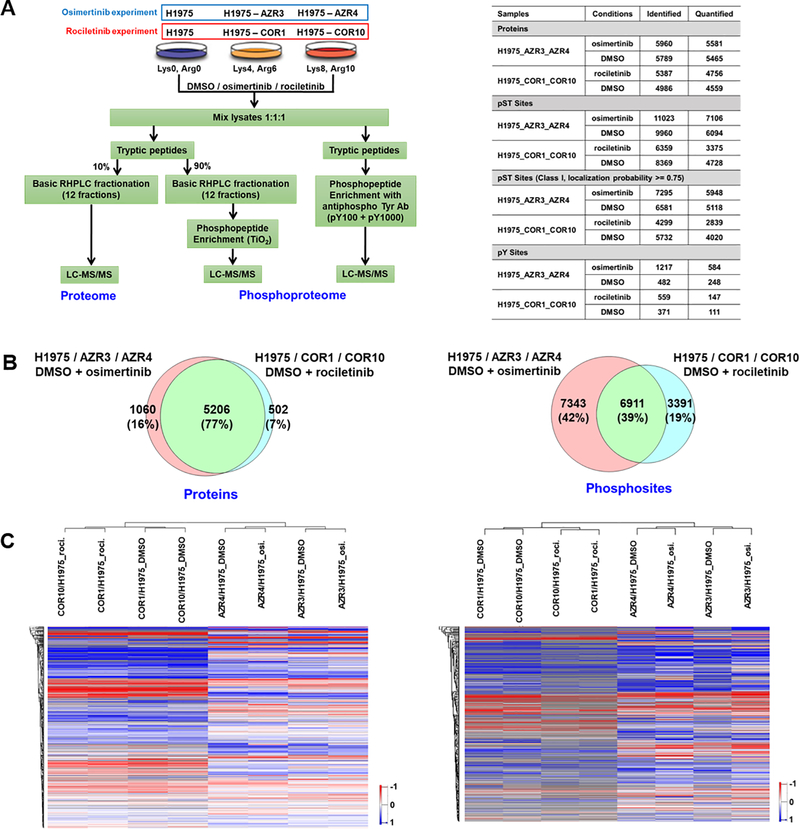
Fig. 1.
Summary of SILAC-based quantitative proteome and phosphoproteome analyses of isogenic 3rd generation EGFR TKI-sensitive and resistant lung adenocarcinoma cells. (A) Experimental workflow showing treatment of SILAC-labelled cells, enrichment of phosphopeptides, and detection by tandem mass spectrometry. TKI-sensitive H1975, osimertinib-resistant AZR3/AZR4 cells, and rociletinib-resistant COR1/COR10 cells were treated with DMSO or the corresponding TKI (Left panel). Summary table showing the number of proteins and phosphosites identified in each experiment (Right panel). (B) Venn diagrams of proteins (left panel) and phosphosites (right panel) identified in osimertinib and rociletinib experiments. (C) Hierarchical clustering of proteins (left panel) and phosphosites (right panel) based on SILAC ratios. Columns represent different cell lines treated as indicated. Rows represent quantified proteins or phosphopeptides identified in all experimental conditions.

