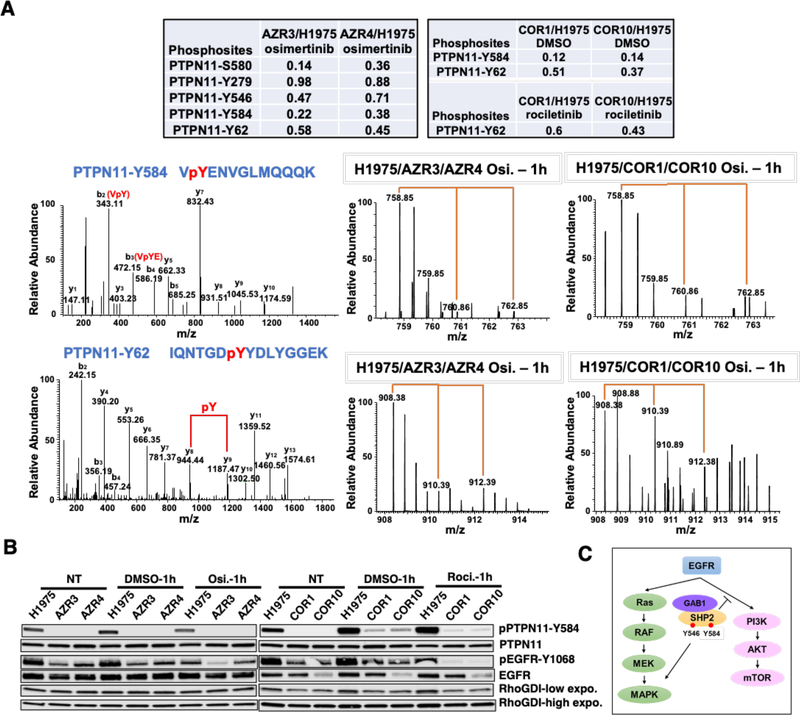
Fig. 5.
Phosphorylation alteration of different phosphosites of the phosphatases PTPN11. (A) Multiple phosphorylation sites of PTPN11 identified and quantified in both osimertinib and rociletinib resistant cells. The SILAC ratios indicate the relative abundance between the resistant and H1975 sensitive cells (upper panel). Annotated MS/MS spectra (left) and MS spectra of their parent ions (middle and right) of the phosphopeptides VpYENVGLMQQQK (Y584) (middle panel) and IQNTGDpYYDLYGGEK (Y62) (lower panel) of PTPN11 showing the relative abundance changes between the sensitive and resistant cells in osimertinib and rociletinib experiment. (B) Western blots showing changes in phosphorylation and total protein expression of PTPN11 and EGFR without TKI treatment and upon 1 hour of rociletinib (100 nM) or osimertinib (50 nM) treatment in H1975, COR1, COR10, AZR3, and AZR4 cells. (C) Schematic showing the role of SHP2 in the activation of RAS/MAPK and inhibition of PI3K/AKT signaling pathways downstream from EGFR.

