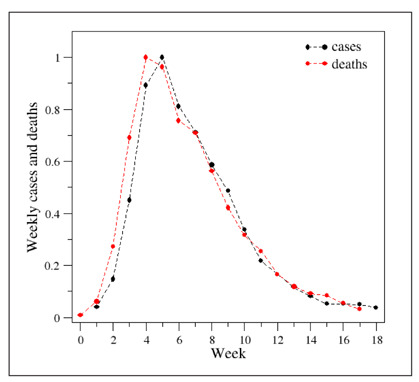
Figure 3.

Comparison of the evolution of the weekly cases (black) and deaths (red) upon normalization of the curves. The normalization was performed by dividing the actual values by the maximum of each ensemble. The curve of cases is one-week shifted ahead.
