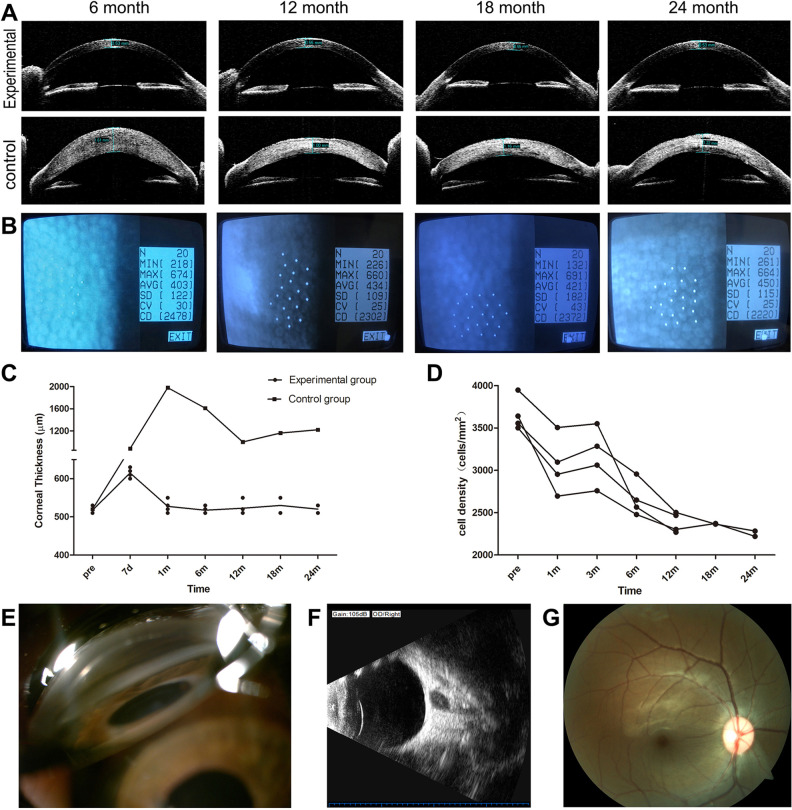
Figure 3.
Ophthalmic examinations of the experimental group and control group during 2-year observation. (A) Visante OCT showed significant corneal thickness differences in the experimental group and the control group (Monkey 1 and 2). (B) Non-contact specular microscopy showed that cells after transplantation were in the form of a polygonal monolayer (Monkey 1). (C) The changes of corneal thickness in the experimental group and control group. (D) The changes of cell density in the experimental group. (E) Chamber angle examination. (F) B-ultrasonography. (G) Fundus imaging. (E–G: Monkey 1 at 2-year time is shown)

