Figure 4.
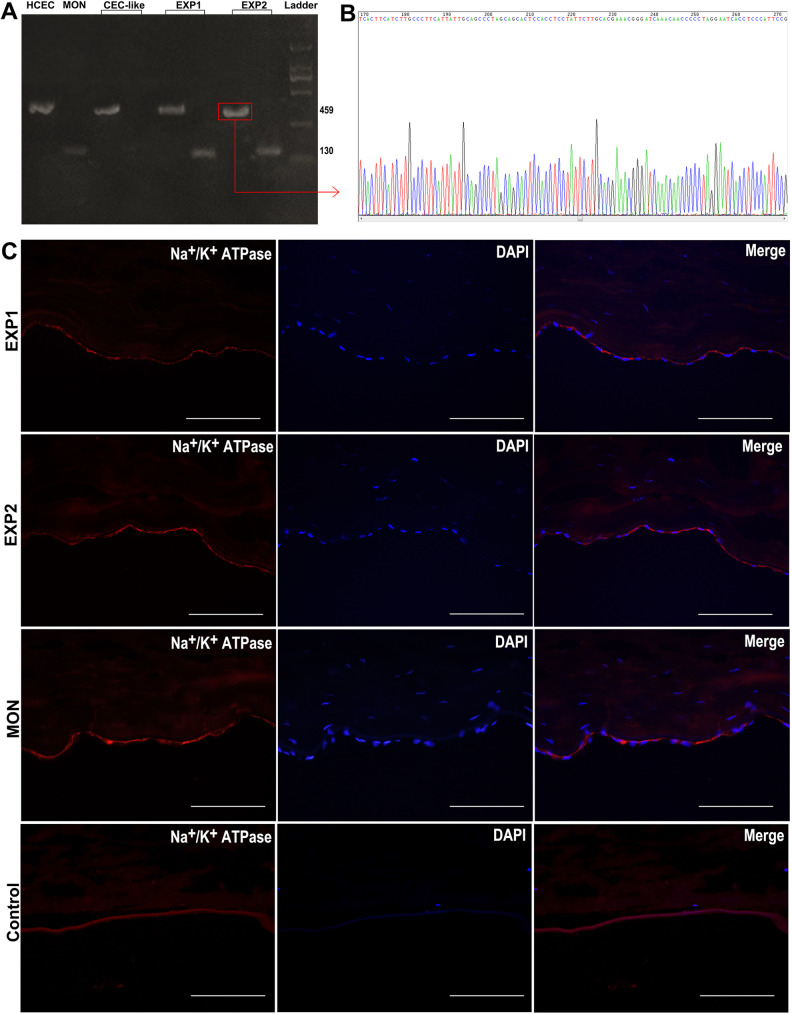
DNA-sequencing and immunofluorescent staining after transplantation. (A) Polymerase chain reaction of HCEC, MON cells, CEC-like cells, EXP1 cells, EXP2 cells. (B) DNA-sequencing of EXP2 456 bp gene fragment products. (C) Immunofluorescent staining of the EXP1, EXP2, MON and control group. Scar bars 100 μm.

