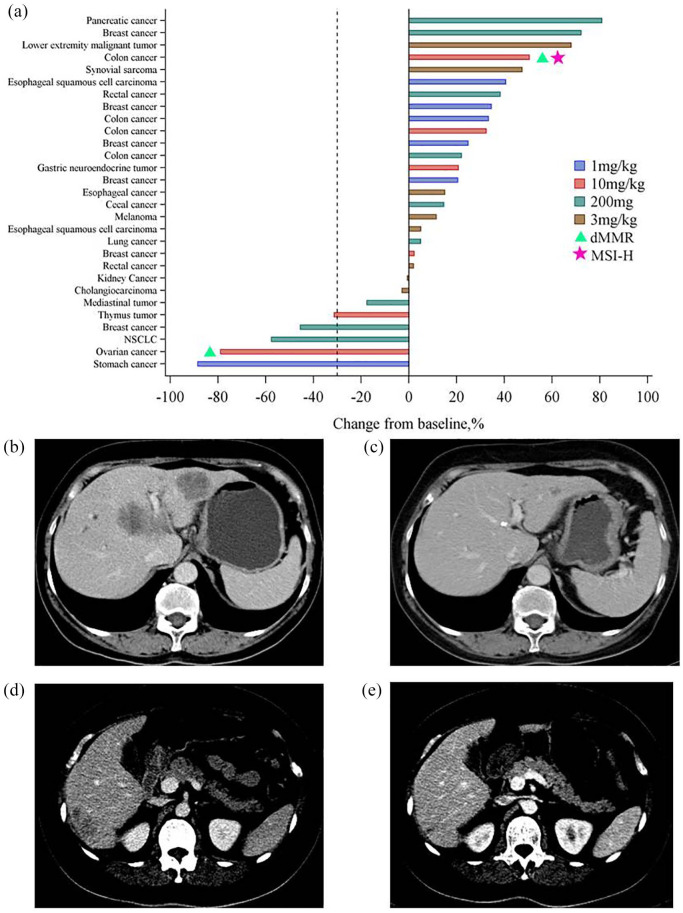
Figure 3.
Tumor response evaluation. (a) Waterfall plot of the maximum percentage change in the sum of target lesion diameters from baseline in evaluable patients (n = 29). Most patients underwent MMR and MSI assessments (18 for MSI and 15 for MMR); dMMR and MSI-H are indicated by triangles and pentagrams, respectively. (b, c) One PR with tumor shrinkage at 1 mg/kg after 23 weeks of treatment (c) with pucotenlimab compared with baseline (b). (d, e) One PR with tumor shrinkage at 10 mg/kg after 23 weeks of treatment (e) with pucotenlimab compared with baseline (d).
dMMR, deficient MMR; MMR, mismatch repair; MSI, microsatellite instability; MSI-H; MSI high; PR, partial response.

