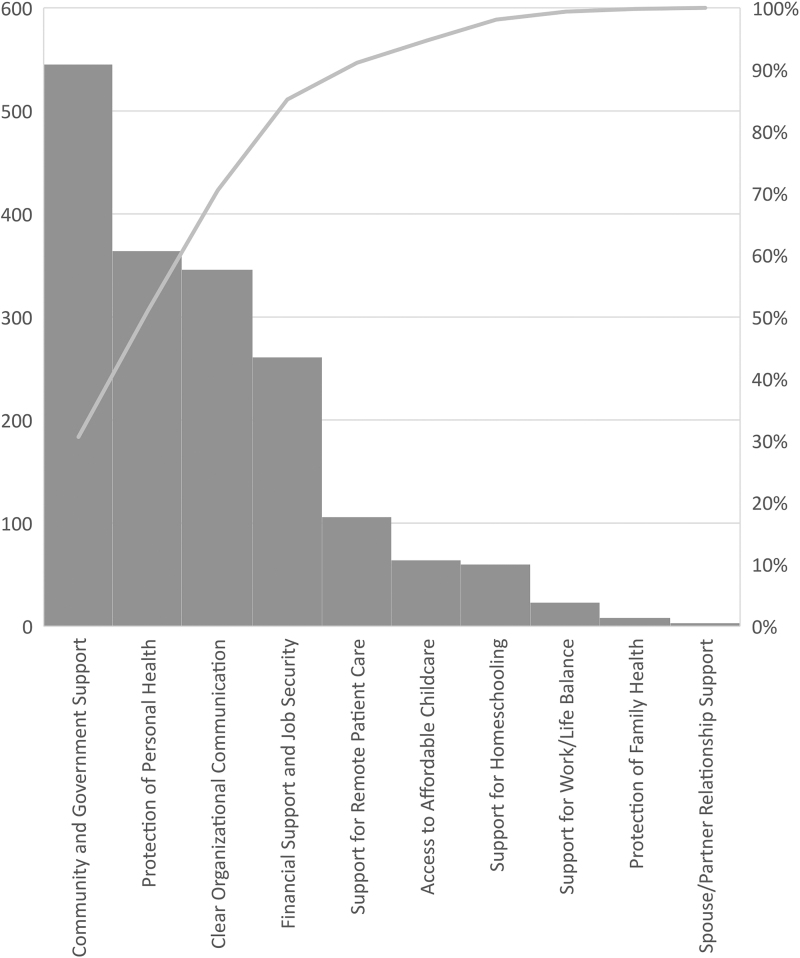
FIG. 2.
Frequency of themes reported as suggestions, needs, or solutions. Columns represent the frequency of each theme as referenced in response to the question of current needs or suggested solutions to address challenges related to the pandemic. The line represents the cumulative percent of reported themes.

