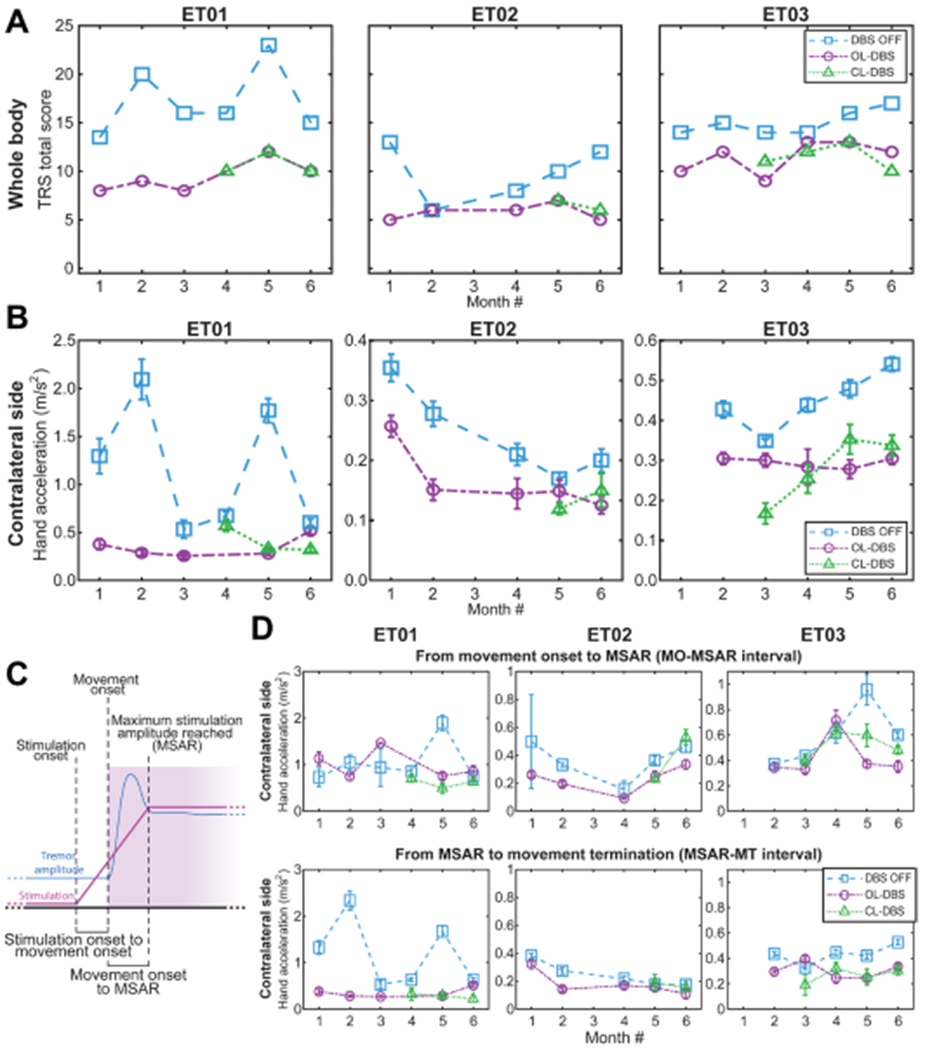
Fig. 4. Longitudinal clinical outcomes for CL-DBS during specific stimulation and movement events.

(A) Clinical TRS over 6-month visits across different DBS modalities. CL-DBS scores are presented starting with the month it was established in each patient. For patient ET01, the score for OL-DBS is missing on month 4 due to subject exhaustion. For patient ET02, month 3 scores were not assessed due to medical reasons unrelated to the study. (B) Tremor amplitude based on acceleration during the execution of the TRS clinical assessment shown in (A). For patient ET03, month 1 inertial data during TRS evaluation were not collected. (C) Diagram of the subdivisions of interest: SO, MO, time maximum stimulation amplitude reached (MSAR), MT, delay MO to SO (interval MO-SO), and delay MO to MSAR (interval MO-MSAR). (D) Tremor amplitude based on acceleration during the execution of the TRS clinical assessment over 6 monthly visits across different DBS modalities, as shown in (A) and (B). Top, tremor amplitude during the MO-SO interval; bottom, tremor amplitude during the MSAR-MT interval. For patient ET01, the score for OL-DBS is missing on month 4 due to subject exhaustion. For patient ET02, month 3 scores were not assessed due to medical reasons unrelated to the study. For patient ET03 month, inertial data during TRS evaluation were not collected. DBS OFF and OL-DBS settings do not have a ramp-up interval, and to achieve a comparison across different DBS settings (DBS OFF, OL-DBS, and CL-DBS), we use the MO-MSAR interval from the CL-DBS recorded during the same month. If no CL-DBS was executed during that month, we used the patient-matched MO-MSAR average.
