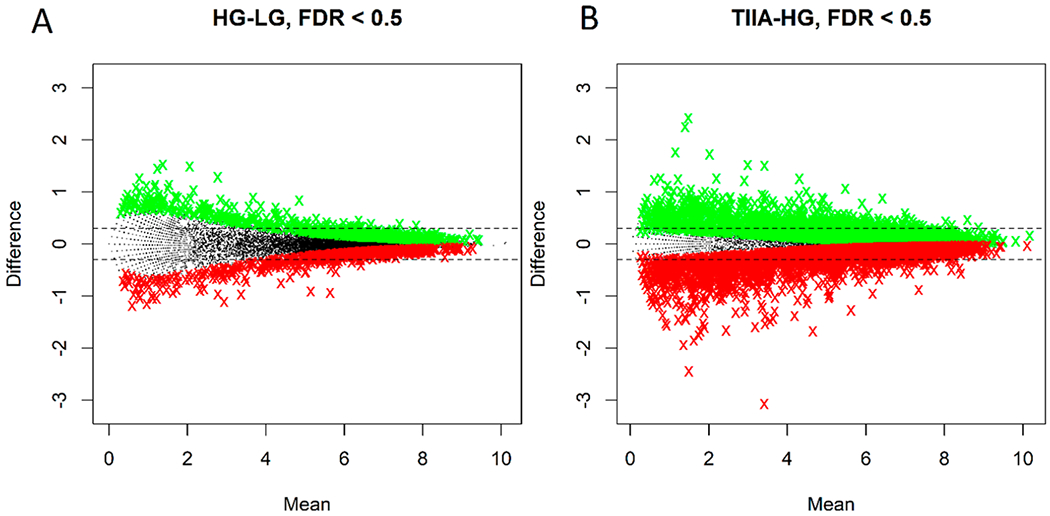
Figure 1.

MA plots of Fragments Per Million mapped fragments (FPM)-normalized gene expressions (log2 means vs log2 difference) for the two comparisons: HG vs LG (A) and TIIA in HG vs HG only (B). The two horizontal dotted lines correspond to log2 differences of ±0.3. The colored symbols correspond to upregulated (green) and downregulated (red) genes with q-values of 0.5 or less.
