Figure 3.

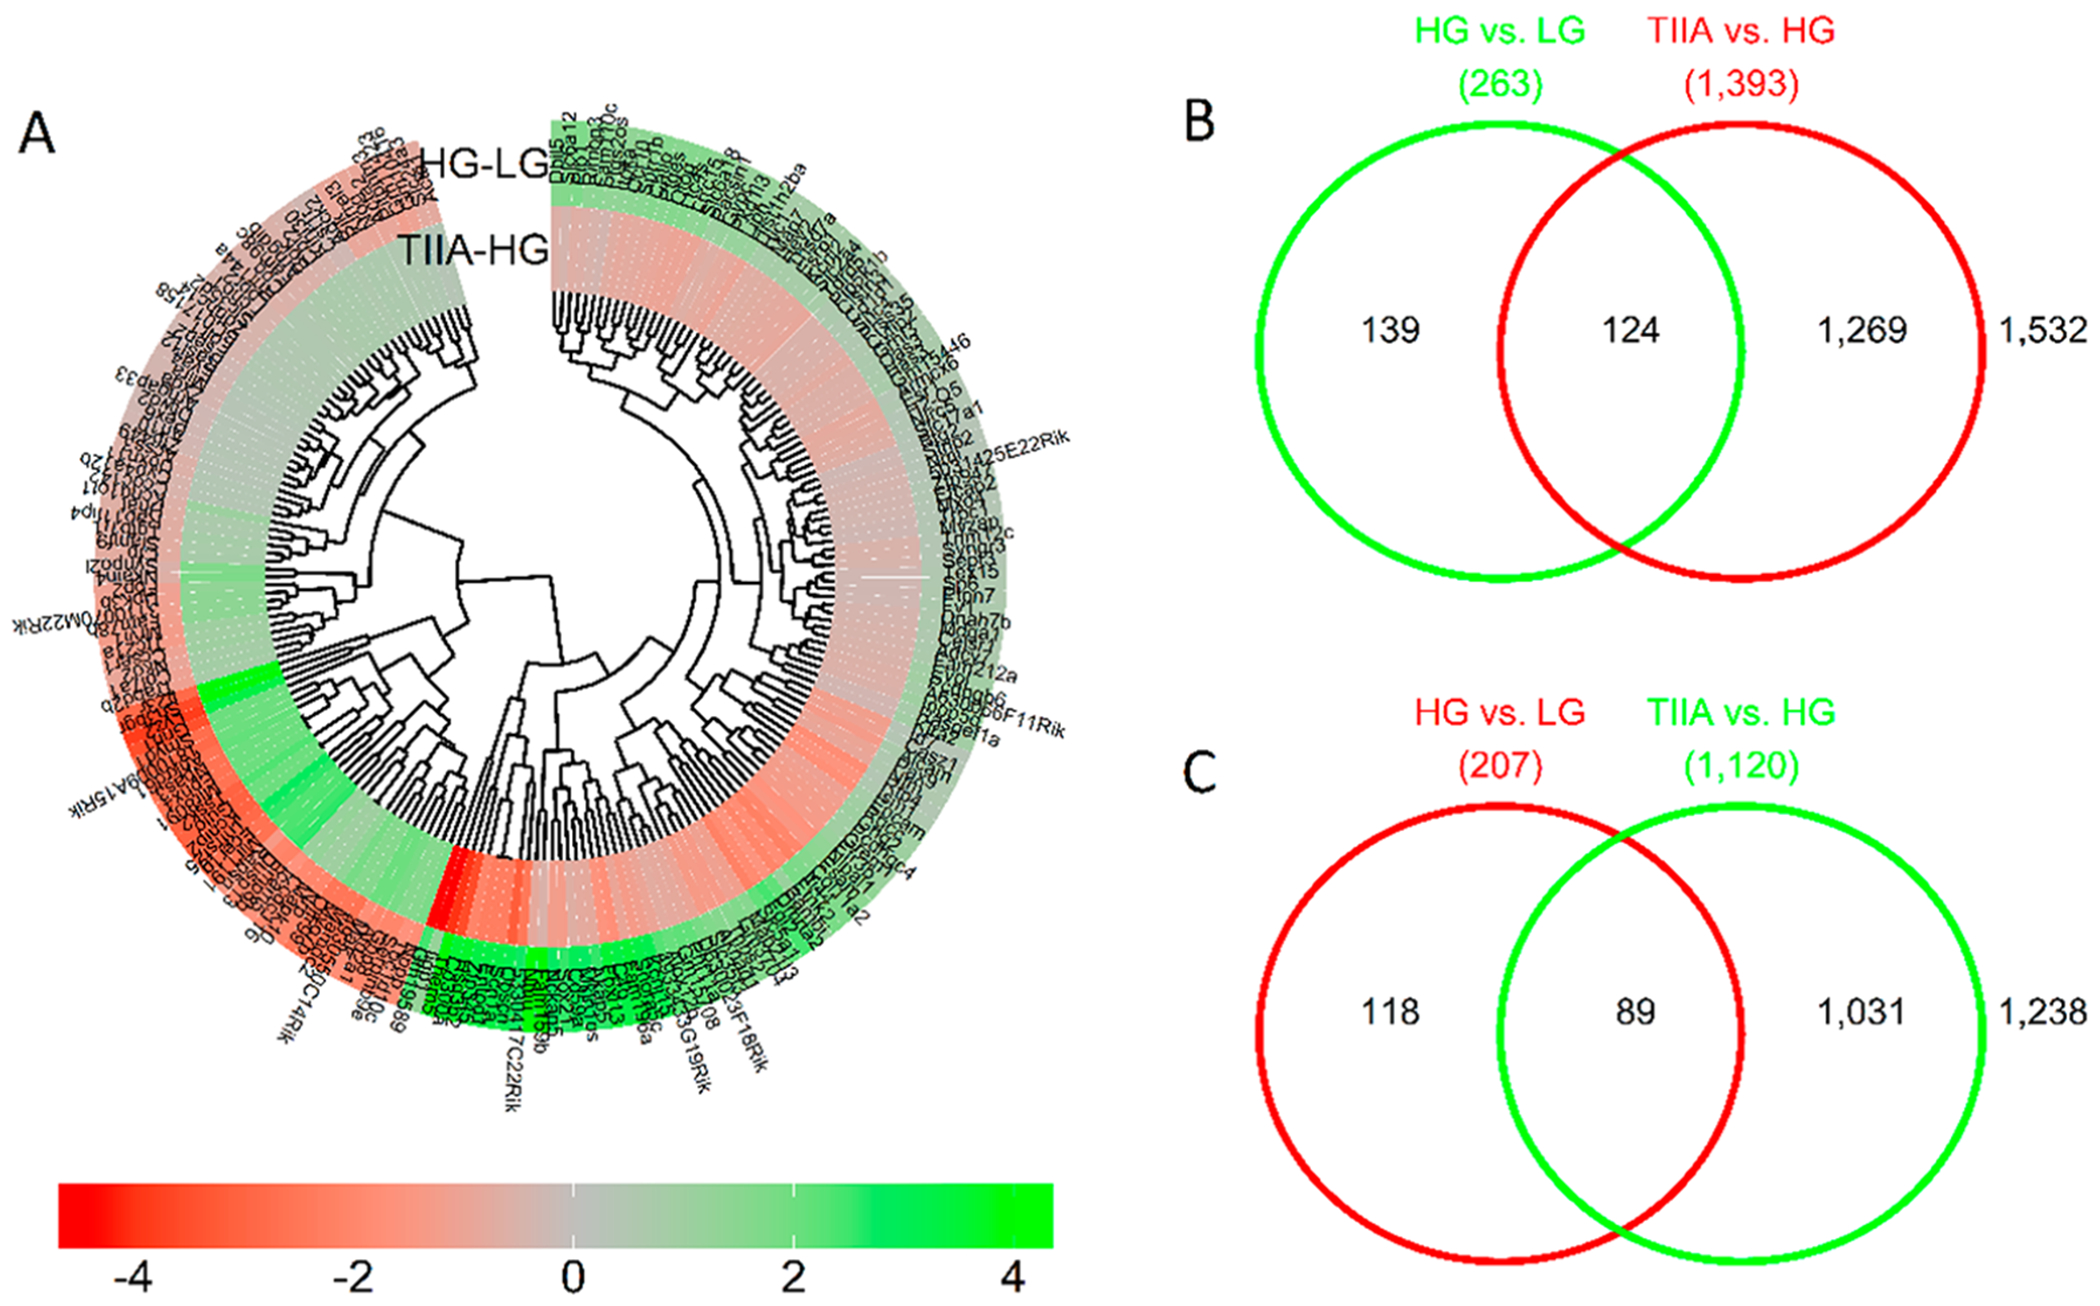
Overview of the differentially expressed genes (absolute log2 difference greater than 0.3) in the two comparisons: HG vs LG and TIIA vs HG. The heatmap of differentially expressed genes (A) shows 124 genes upregulated by HG and downregulated by TIIA (B), and 89 genes downregulated by HG and upregulated by TIIA(C).
