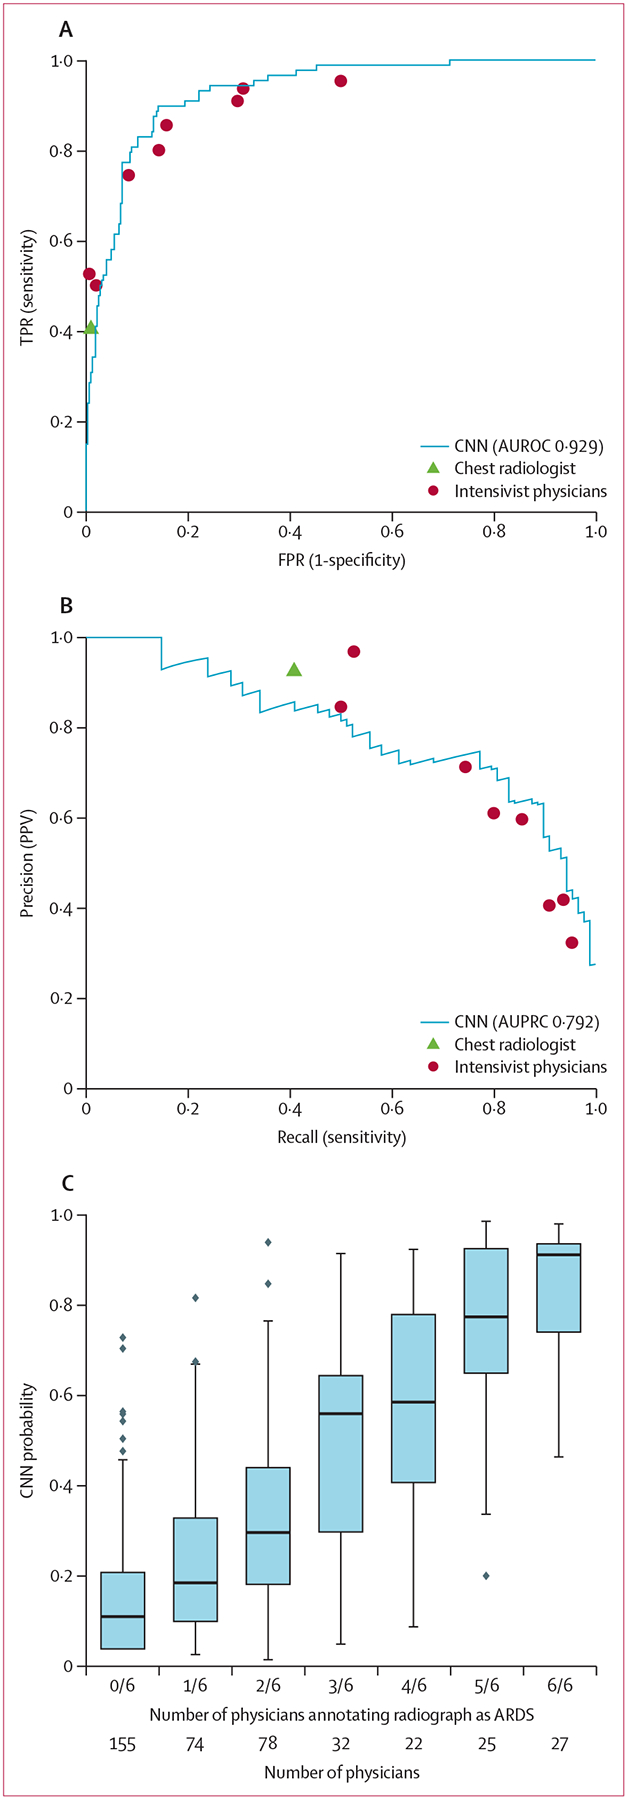
Figure 1: CNN performance for identifying ARDS on chest radiographs compared to individual physician performance in the internal holdout test set.

The deep CNN was compared with individual physicians in the subgroup of 413 chest radiographs that were each reviewed by at least six physicians, including a chest radiologist and physicians trained in intensive care medicine. Individual physician performance was determined using a reference standard that was derived based on ARDS annotations from the five other physicians reviewing the same radiograph. (A) CNN receiver operating characteristics curve plotted against individual physician TPR and FPR, and AUROC. (B) CNN precision-recall curve plotted against individual physician precision (PPV) and recall (sensitivity), and AUPRC. (C) CNN probability outputs for chest radiographs grouped by the number of physicians annotating each as ARDS. Boxplots show median, 25th and 75th percentile, and 1·5 × IQR. Dots represent points outside this range. CNN=convolutional neural network. ARDS=acute respiratory distress syndrome. AUROC=area under the receiver operator characteristic curve. AUPRC=area under the precision-recall curve. TPR=true positive rate. FPR=false positive rate. PPV=positive predictive value.
