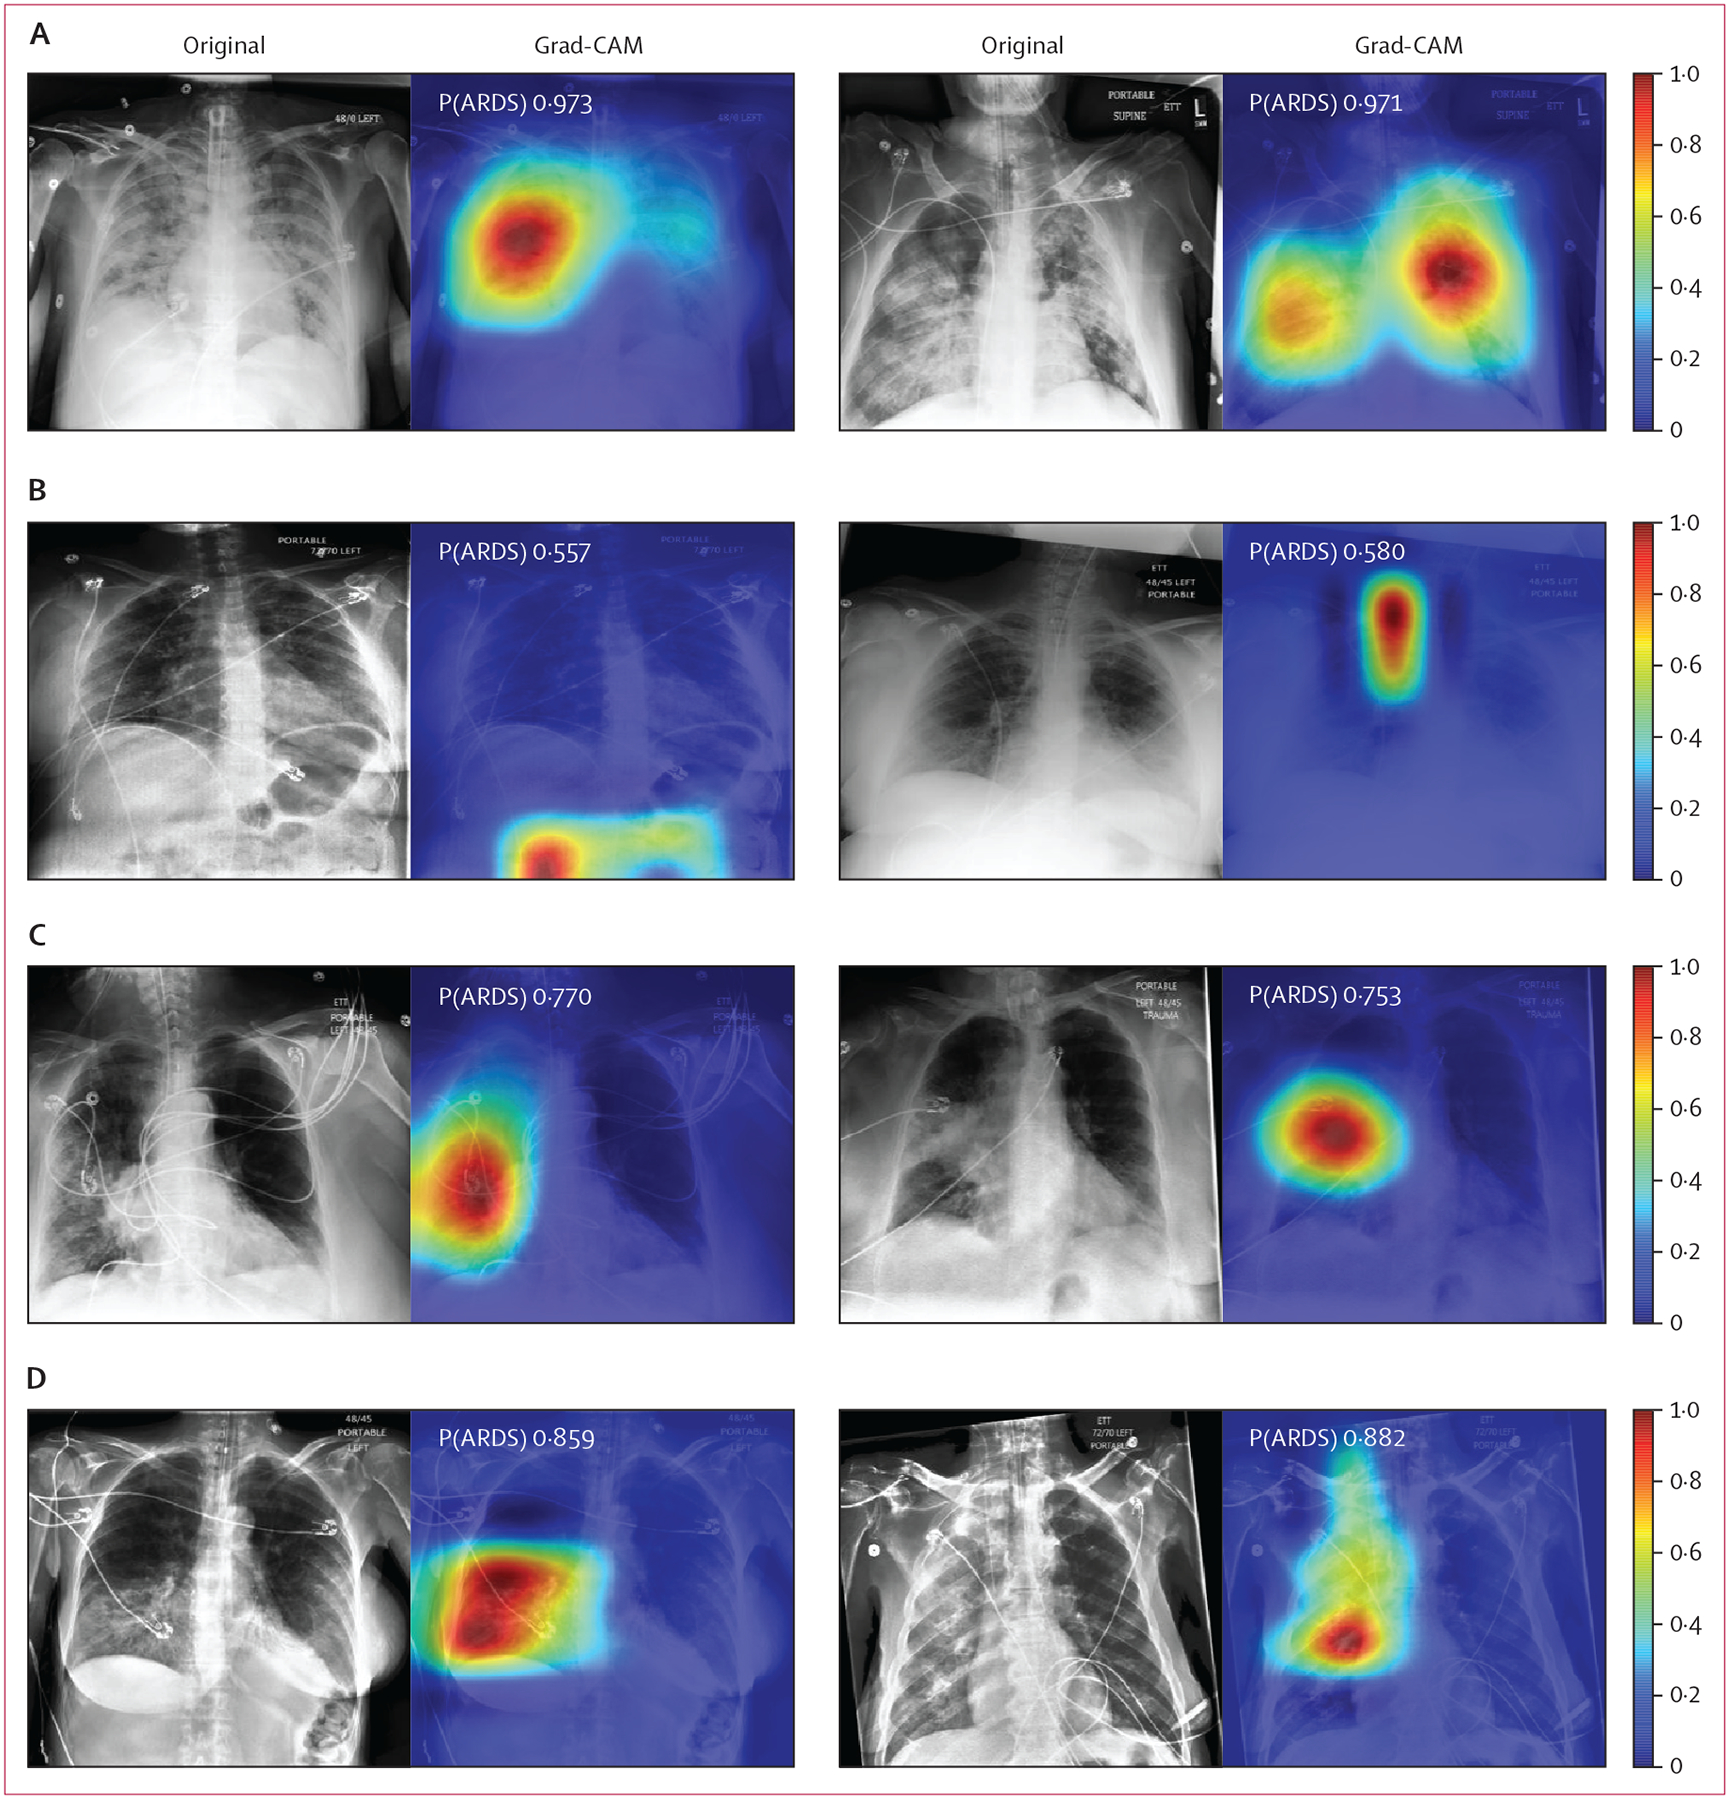
Figure 2: Visualising CNN activations in chest radiographs for error analysis in ARDS detection.

Chest radiographs were grouped based on CNN probabilities of ARDS and physician ARDS annotations and then Grad-CAM was used to localise areas used by the CNN to identify ARDS within the radiographs. The heat map illustrates the importance of local areas within the image for classification. The importance value is scaled between 0 and 1 where a higher number indicates that the area is of higher importance for classifying the image as consistent with ARDS. (A) Chest radiographs annotated as ARDS by six of six physicians and assigned a high CNN probability. (B) Chest radiographs scored as consistent by six of six physicians but assigned a lower probability by the CNN. (C) Chest radiographs annotated as ARDS by zero of six physicians but assigned a high probability by the CNN. (D) Chest radiographs with disagreement among physicians (three of six physicians annotating ARDS) and assigned a high probability by the CNN. CNN=convolutional neural network. ARDS=acute respiratory distress syndrome. Grad-CAM=gradient-weighted class activation mapping. P(ARDS)=probability that the chest radiograph is consistent with ARDS.
