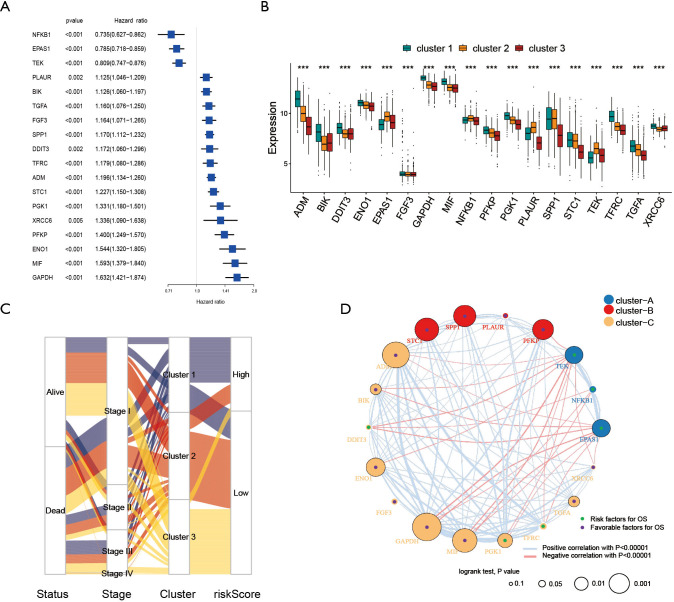
Figure 5.
Interrelationships among signature factors. (A) Forest plot was used to display the prognostic significance of factors in the signature. (B) Analysis of the differences of signature factors in three hypoxia modification patterns. (C) Alluvial diagram showed the connection and changes of status, stage, cluster and riskScore. (D) Interaction among signature factors. The size of circle represented the influence of each signature on the prognosis. The green dots in the circle represented prognostic risk factors, while the purple dots in the circle represented prognostic favorable factors. The lines connecting the signature factors showed their interaction, and the thickness indicated the mutual strength. Negative correlation was blue, while positive correlation was red. The signature factors were divided into three groups, marked with red, yellow and blue. (***, P<0.001).

