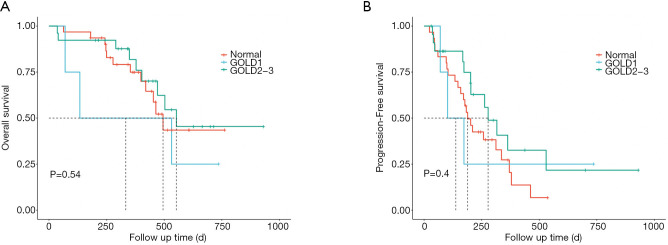
Figure 4.
Treatment outcome of ICIs according to COPD severity. (A) Kaplan-Meier curve of OS by COPD severity. (B) Kaplan-Meier analysis of the PFS probability by COPD severity. Risk group stratification within COPD severity. Those with moderate and severe COPD tended to have better OS (553 vs. 495 days, P=0.54) and PFS (278 vs. 189 days, P=0.4) as compared to the non-COPD group. GOLD 1, mild COPD; GOLD 2, moderate COPD; GOLD 3, severe COPD; ICI, immune checkpoint inhibitor; COPD, chronic obstructive pulmonary disease; OS, overall survival; PFS, progression-free survival.

