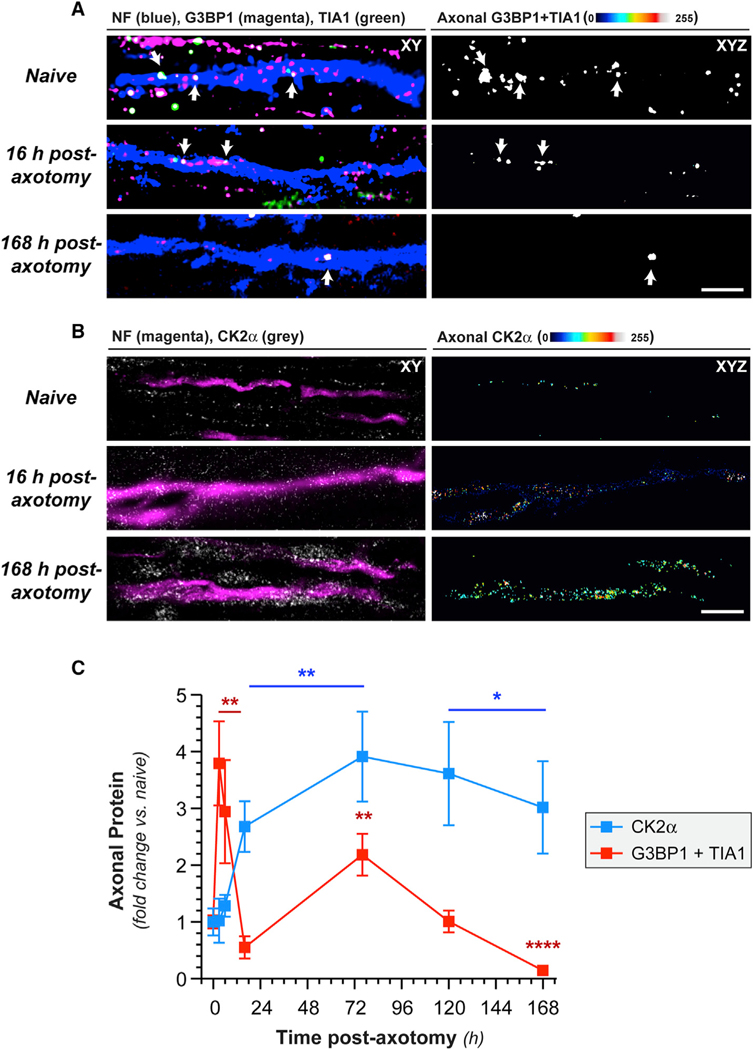
Figure 1. Axotomy Increases Axonal CK2α Protein.
(A) Exposure-matched confocal images for G3BP1 and TIA1 in naive and post-injury sciatic nerve. Left column shows granular G3BP1 and TIA1 signals merged with neurofilament (NF) in single XY planes; right column shows XYZ projections of colocalized G3BP1 + TIA1 (arrows) that overlap with NF (“axonal G3BP1 + TIA1”) across individual XY planes.
(B) Exposure-matched confocal images for CK2α in post-injury sciatic nerve. Left column shows CK2α merged with NF in single XY planes, and right column shows XYZ projections of CK2α signals that overlap with NF (“axonal CK2α”) across individual XY planes.
(C) Quantitation of axonal CK2α and colocalized G3BP1 + TIA1 from sciatic nerve axons imaged as in (A) and (B) shown as mean ± SEM (N = 6 animals; *p ≤ 0.05,**p ≤ 0.01, and ****p ≤ 0.0001 by Student’s t test versus t = 0 h; scale bars represent 5 μm in A and 10 μm in B).

