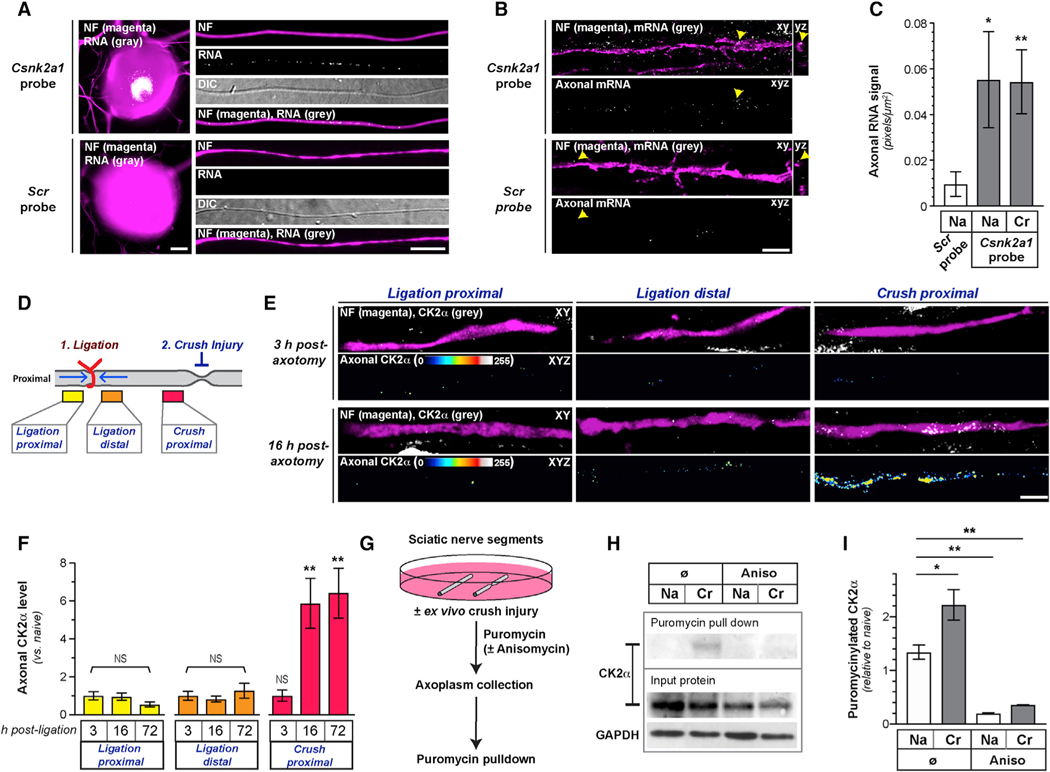
Figure 3. CK2α Is Locally Translated in PNS Axons.
(A) Images of smFISH/IF for Csnk2a1 mRNA and scrambled probe plus NF protein for cell body and axons of naive DRG neurons (scale bar represents 10 μm).
(B and C) Exposure-matched confocal images Csnk2a1 mRNA versus scrambled probe plus NF protein in naive sciatic nerves shown in (B). Upper panels of image pairs show Csnk2a1 mRNA merged with NF protein signals in XY planes, with orthogonal projections to right (arrows indicate location for YZ projections); lower panel of each pair shows XYZ projection of RNA signals that overlap with NF (“axonal RNA”) across individual XY planes. (C) shows quantitation of axonal Csnk2a1 mRNA from naive (Na) and crushed (Cr) sciatic nerve axons as mean ± SEM (N = 6 animals; *p ≤ 0.05 and **p ≤ 0.01 by Student’s t test for indicated groups versus scrambled control; scale bar represents 5 μm).
(D) Schematic of nerve ligation experiment used in (E) and (F) and Figure S2D.
(E and F) Exposure-matched confocal images for CK2α in post-injury sciatic nerve from proximal and distal to ligation site and proximal to crush site in (E). Upper rows of image pairs show CK2α merged with NF in single XY planes; bottom rows show XYZ projections of CK2α signals that overlap with NF (axonal CK2α) across individual XY planes. (F) shows quantitation of axonal CK2α from ligation and crush sites in sciatic nerve as mean ± SEM (N = 5 animals; **p ≤ 0.01; NS, non-significant by Student’s t test for indicated time points versus 3 h; scale bar represents 10 μm).
(G) Schematic of ex vivo sciatic nerve injury and puromycinylation experiment used in (H) and (I) and Figure S2E.
(H and I) Representative immunoblots of input and puromycinylated protein from axoplasm of Na and ex vivo Cr sciatic nerve shown in (H). Quantitation of puromycinylated CK2α versus total CK2α in sciatic nerve axoplasm is shown in (I) as mean ± SEM (N = 3; *p ≤ 0.05 and **p ≤ 0.01 by Student’s t test for indicated conditions).
Related to Figure S2.

