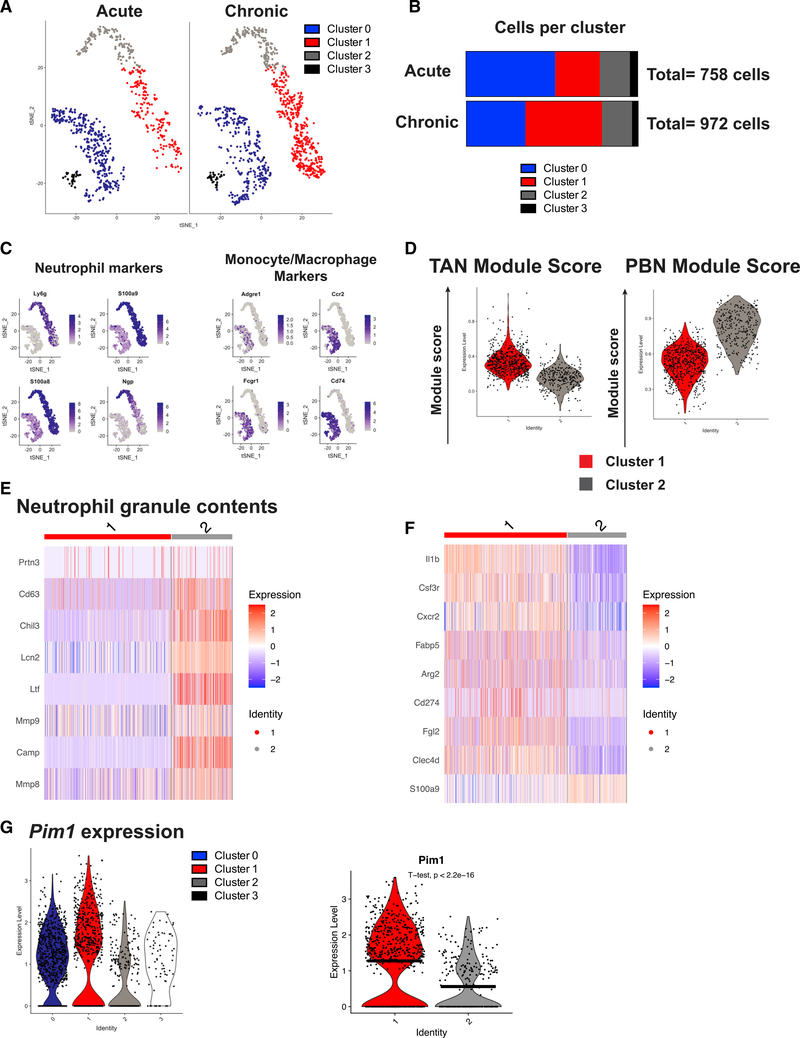
Figure 1. scRNA-seq reveals heterogeneity in the myeloid compartment.
(A) t-SNE projection of 1,730 myeloid cells from mice infected with 2 × 10² (acute) or 2 × 10⁶ (chronic) PFUs LCMV clone 13 from the spleen.
(B) Cells from (A) separated by infection dose and quantified in a stacked bar graph.
(C) Feature plots showing expression of neutrophil-associated genes (Ly6g, S100a9, S100a8, and Ngp) and key markers of monocytes/macrophages (Adgre1, Ccr2, Fcgr1, and Cd74).
(D) TAN and PBN module scores were calculated using genes upregulated more than 1 log-fold change (logFC) in TANs versus PBNs or vice versa, respectively, from GSE118245.
(E) Heatmap depicting expression of genes encoding neutrophil granule components.
(F) Expression of selected known markers associated with suppressive neutrophils or transcripts known to regulate immune function.
(G) Violin plots showing expression of Pim1 in all four myeloid cell clusters from LCMV clone 13 infection (left) and violin plot comparing Pim1 expression between clusters 1 and 2 via a t test (right). Black horizontal lines denote mean expression.

