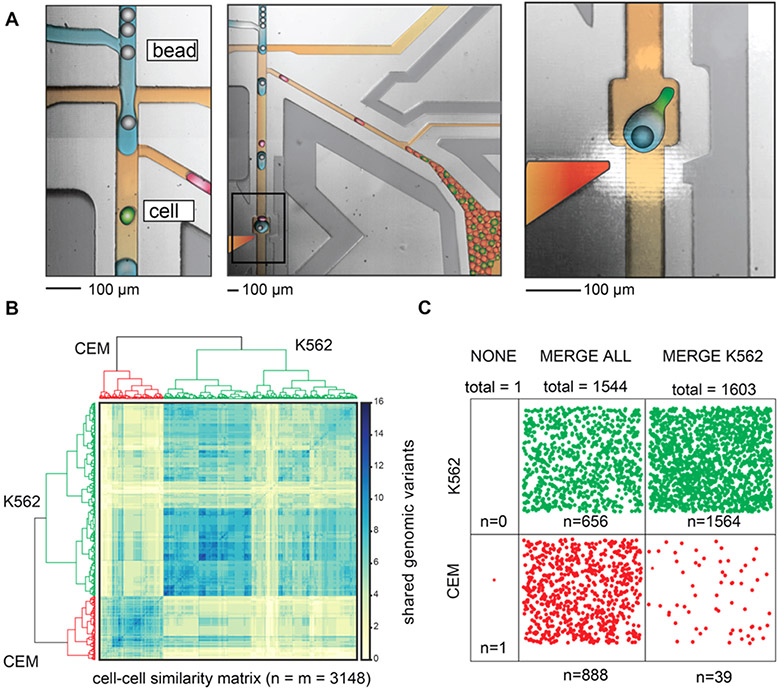
Figure 4.
Single-cell DNA seq of cancer-related genomic loci from a leukemia cell subpopulation using the fluorescence-activated droplet merger. (A) Microscope image of the microfluidic device for the selective merger of barcoded beads with cell lysate drops. Left: Operation of the merger device showing bead reinjection, reagent drop formation, and cell lysate drop reinjection. The drops are colored red (negative, CEM) and green (positive, K562) to aid in the figure interpretation. Middle: drop pairing and merger. Right: Higher-magnification images showing bead-drop:cell-drop pairing and drop merger. The PCR mix is colored blue, oil is colored brown, positive cell drops are colored green, negative cell drops are colored red, barcoded beads are colored gray, and electrode is colored red-orange. (B) Bioinformatic analysis of single-cell genome sequencing. The clustering of genomic mutations identifies the cell of origin. The cells are classified accordingly. (C) Distribution of the classified cells in different samples. Merging all drops with the barcoded beads results in equal sequencing of both cancer cell types, while selectively merging with the K562 cells results in targeted scDNA seq of the correct subpopulation.

