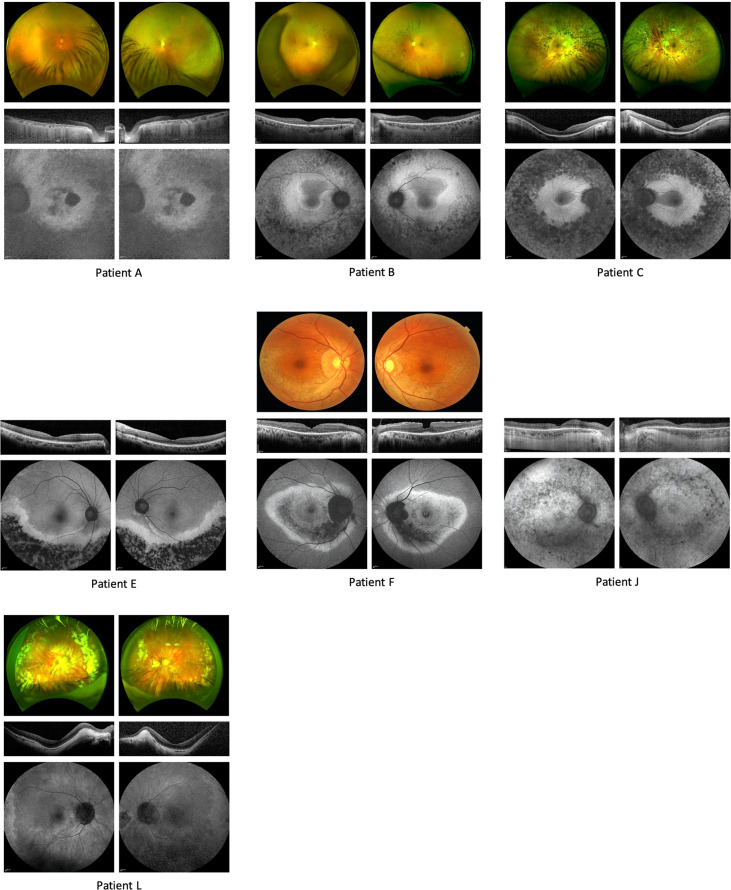
Fig. 2. Fundal imaging demonstrating phenotype of patients A, B, C, E, J & L.
For each patient, fundus photographs (or an Optos® widefield image) is provided in the uppermost panel, a representative Optical Coherence Tomography slice in the centre and Fundus Autofluorescence images in the lowermost panels. For patients E&J, fundus photographs were not available. Please see Supplementary Fig. S1 for imaging of other patients.

