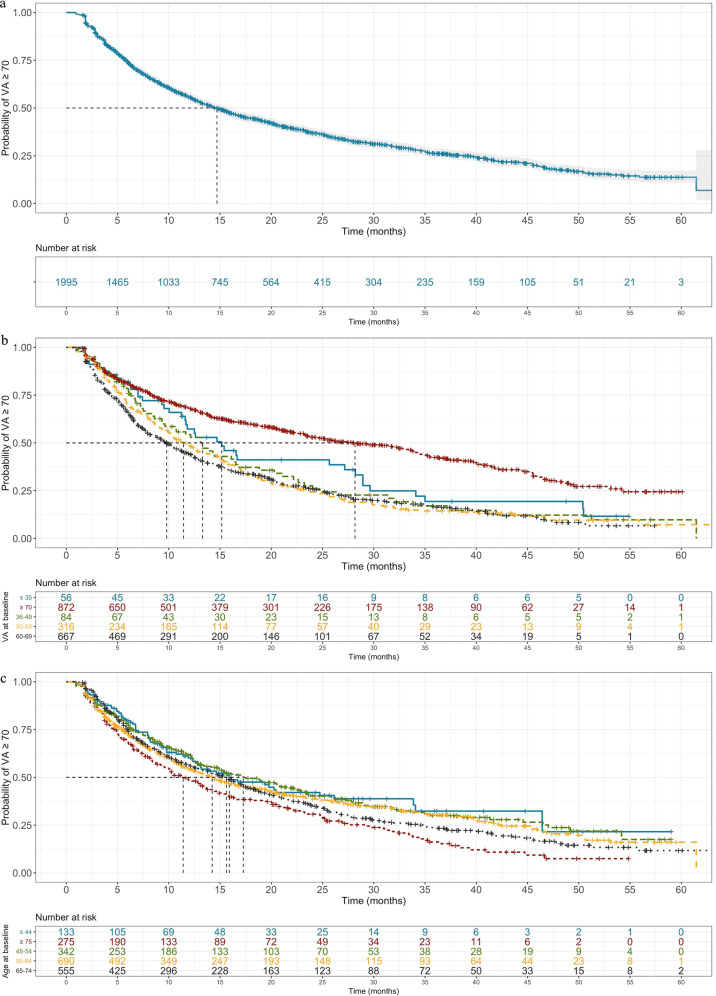
Fig. 3. Time-to-event analysis with outcome being visual acuity < 70 ETDRS letters.
All patients attaining visual acuity (VA) ≥ 70 ETDRS (Early Treatment Diabetic Retinopathy Study) letters in the observation period were taken forward for analysis. Date of reaching this threshold was considering baseline, with time to VA falling below 70 modelled (a). Cohorts were further stratified by statistically significant predictors (Table 2): baseline visual acuity (b) and age at first injection (c). Of note, the sub-cohort of patients that began with VA at or over 70 letters (red line; b) was included in sub-stratified by baseline VA and featured median event time almost twofold greater than the other sub-cohorts.

