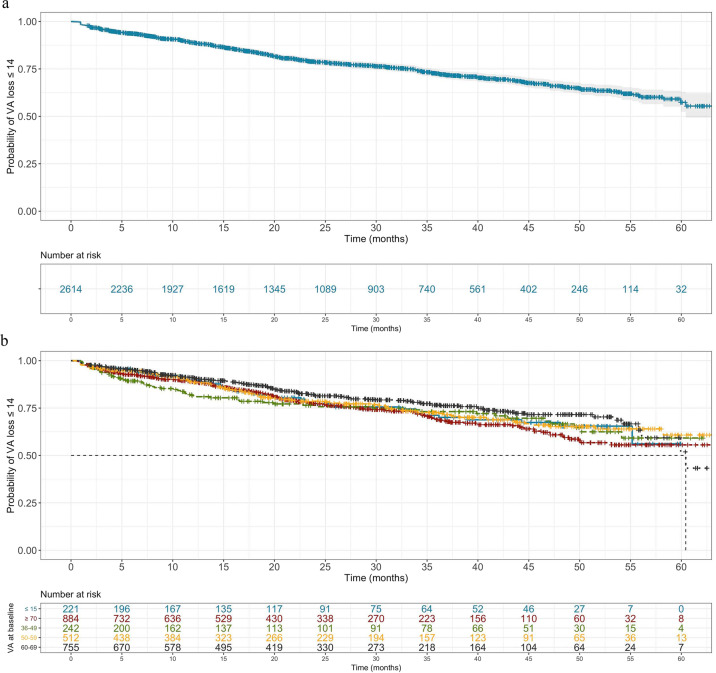
Fig. 4. Time-to-event analysis with outcome being visual acuity loss of 15 or greater.
Date of injection 1 was considered baseline and time to visual acuity (VA) of 15 ETDRS letters or more was modelled (a). Cohort was further stratified by the statistically significant predictor (Table 2) baseline VA (b).

