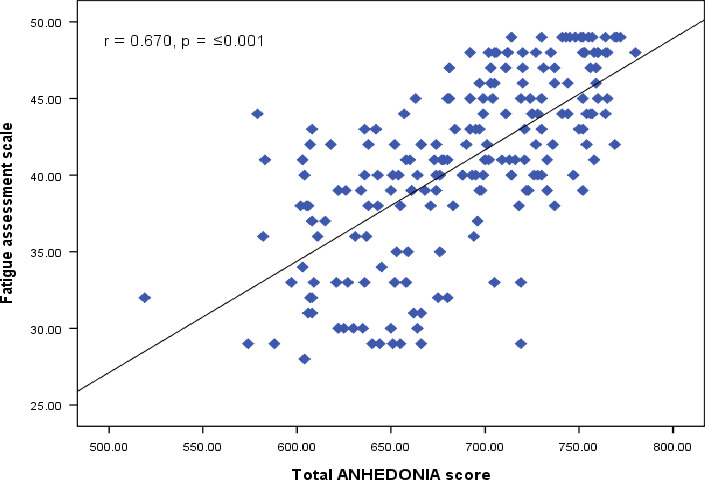
FIGURE 1.

illustrated the association between mean fatigue score and mean anhedonia score [Colour figure can be viewed at wileyonlinelibrary.com]

illustrated the association between mean fatigue score and mean anhedonia score [Colour figure can be viewed at wileyonlinelibrary.com]