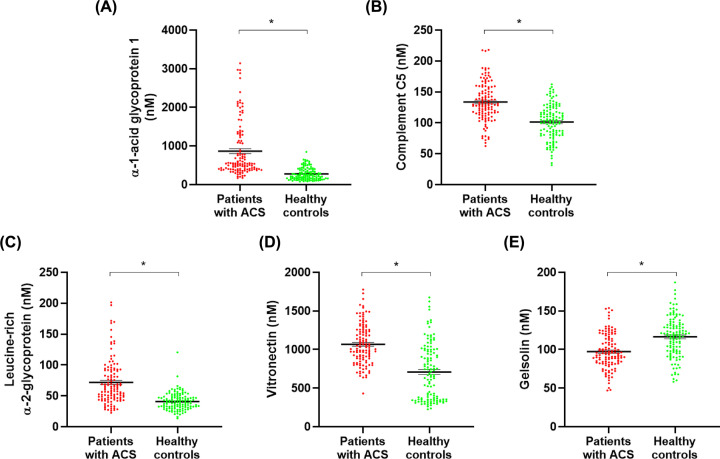
Figure 4. Scatter plots of ACS early diagnostic biomarkers.
Five biomarkers were selected as proteins showing the same expression in the discovery and validation set. The scatter plots indicate expression of biomarkers in patients with ACS and healthy controls. (A) AGP1, (B) complement C5, (C) leucine-rich α -2-glycoprotein, and (D) vitronectin were up-regulated proteins in patients with ACS. In contrast, (E) gelsolin was the down-regulated protein in patients with ACS. The difference in the expression of all biomarkers was statistically significant. Data are presented as mean ± SD. *P<0.001.

