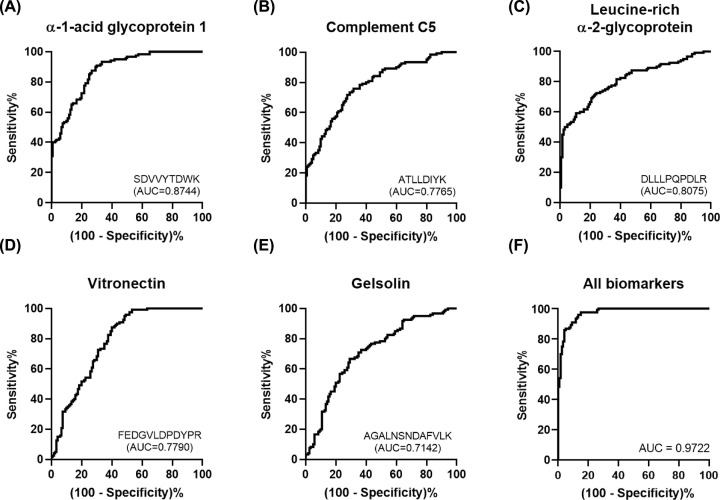
Figure 5. ROC curves of ACS early diagnostic biomarkers.
The ROC curves showed the AUC of ACS early diagnostic biomarkers. (A) The AUC of AGP1 was 0.8744. (B) The AUC of complement C5 was 0.7765. (C) The AUC of leucine-rich α-2-glycoprotein was 0.8075. (D) The AUC of vitronectin was 0.7790. (E) The AUC of gelsolin was 0.7142. All ACS early diagnostic biomarkers had AUC higher than 0.7. (F) The AUC of all combined biomarkers was 0.9722, which displayed the highest result.

