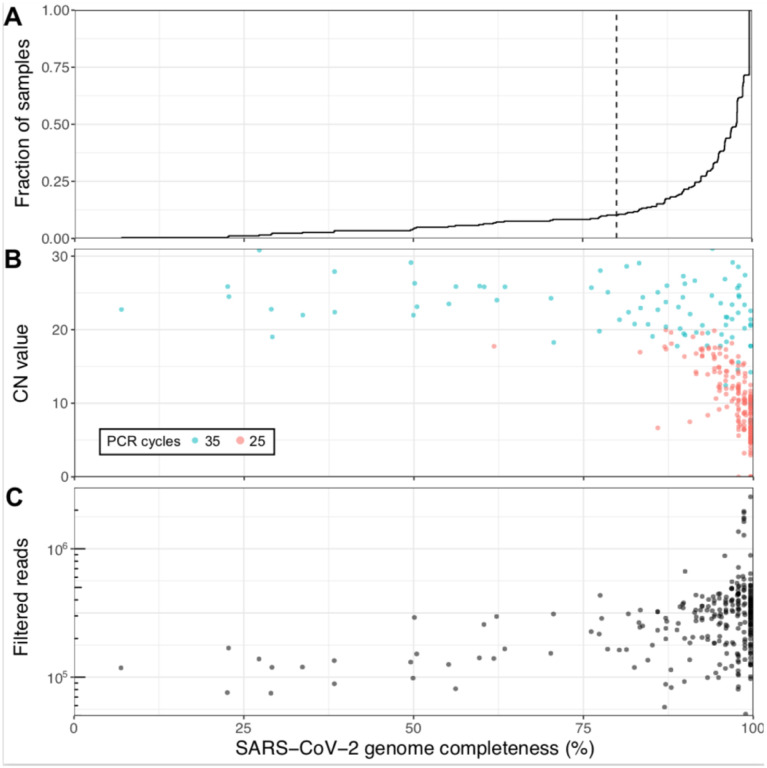
Figure 1: Viral genome sequencing of 264 SARS-CoV-2 samples with Oxford nanopore.
(A) Cumulative distribution of genome completeness using the ARTIC bioinformatics SOP (see methods). Dashed vertical line corresponds to the 80% completeness threshold used for phylogenetic reconstruction. (B) Relationship between CN score at diagnosis, as measured by the Abbott RealTime M2000rt device (higher CN = lower viral load), and genome completeness. (C) Relationship between number of quality passed reads filtered using the ARTIC bioinformatics SOP and genome completeness.

