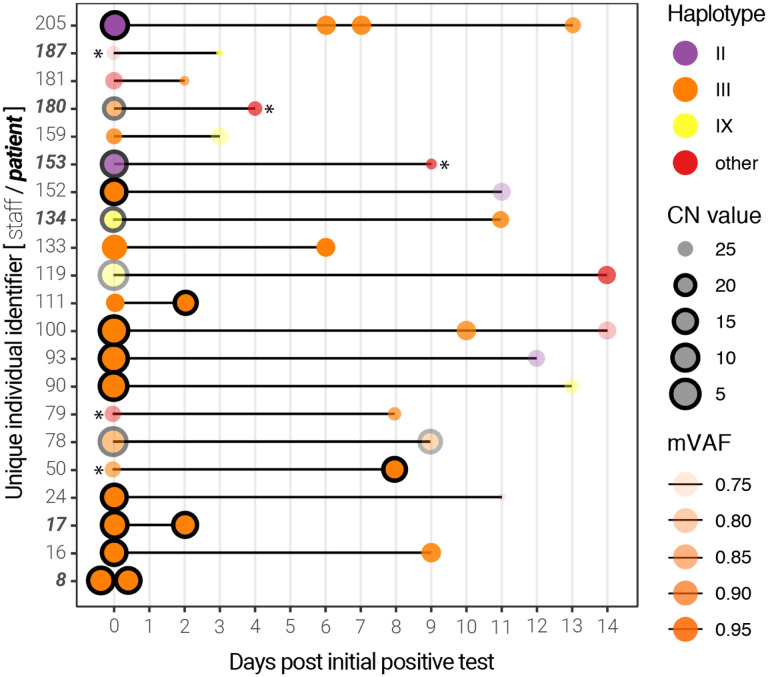
Figure 5. Longitudinal sequencing of SARS-CoV-2 positive subjects.
Multiple samples for the same individual at different time points are linked by a black line. The size of the points represents the CN score at diagnosis (with black edges corresponding to scores ≤ 20) and the opacity represents the mean variant allele frequency (mVAF). Individual 8 was sampled twice on the same day. Asterisks indicate consensus genomes with <80% completeness.

