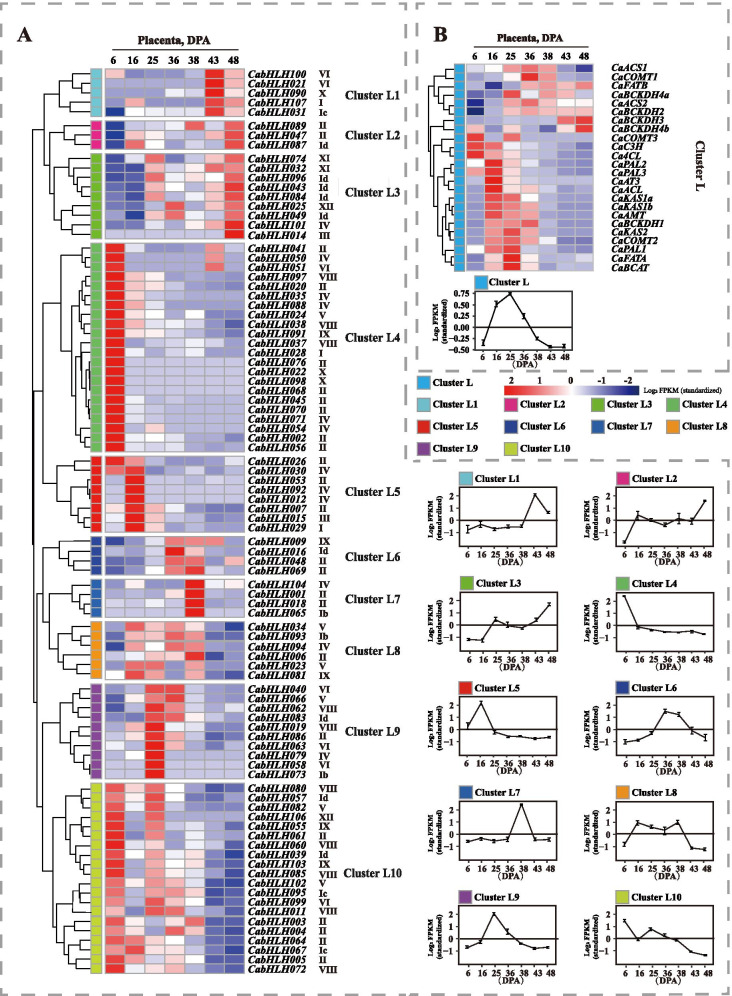
Fig. 5.
Expression profiles of the genes in the placenta at different developmental stages. a. Expression profiles of CabHLH genes at different developmental stages of placenta. b. Expression profiles of capsaicinoid biosynthetic genes at different developmental stages of placenta. The name of each gene and the short name of the phylogenetic group appear to the right of the heat map. Log2 values of FPKM were used to construct the heat map with hierarchical clustering analysis. Line charts were prepared using the mean value for the whole cluster. The letter “L” in cluster L indicates the placenta

