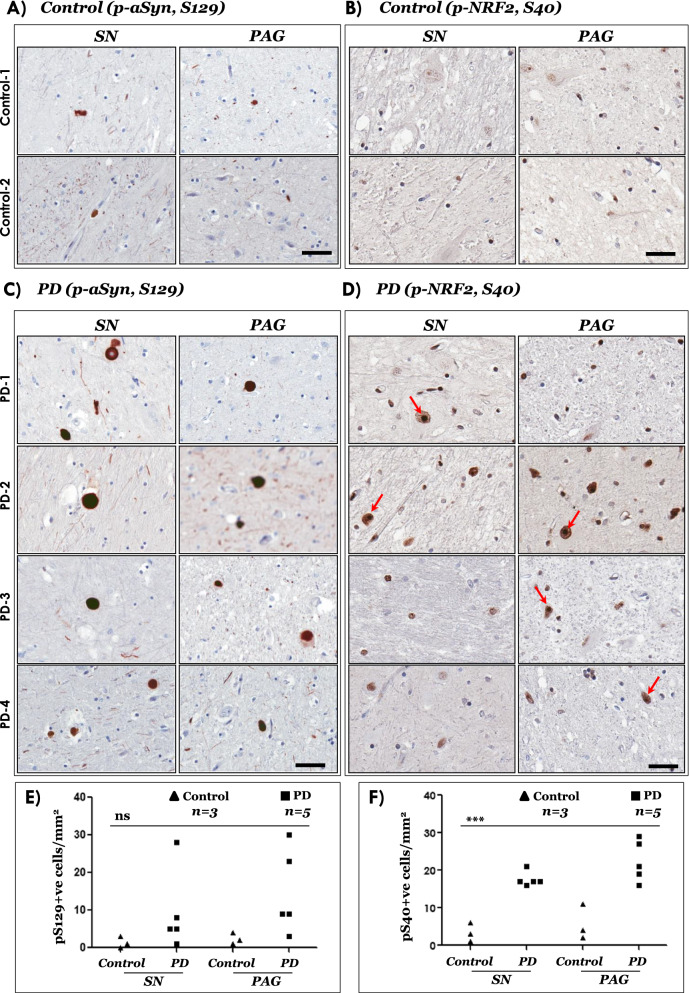
Fig. 1.
Immunostaining of phospho-aSyn (S129) and phospho-NRF2 (S40) in post-mortem control and PD midbrain sections. A–D Representative IHC images showing phospho-aSyn (S129) and phospho-NRF2 (S40) immunostaining in substantia nigra (SN) and periaqueductal grey (PAG) of two controls (A–B) and four PD cases (C, D). Red arrows in the 20 × magnified views point to cells with predominant nuclear localization of phospho-NRF2 (scale bar = 100 µm). Also see Additional file 1: Figure S1 showing panoramic and magnified views from a control and a PD case and Additional file 1: Table S1. Primary antibodies: p-aSyn (S129)-81A (in A, C) and p-NRF2 (S40)-EP1809Y (in B, D). E, F Semi-quantitative analyses of p-aSyn (pS129; in E) and p-NRF2 (pS40; in F) immunopositive cells in the indicated regions of control and PD midbrain sections. Individual data points represent immunopositive cell counts/mm2/region in each section, with controls being depicted as black triangles and PD as the black squares. (SN substantia nigra; PAG periaqueductal grey matter; One-way ANOVA: ns, not significant; ***p < 0.0001)

