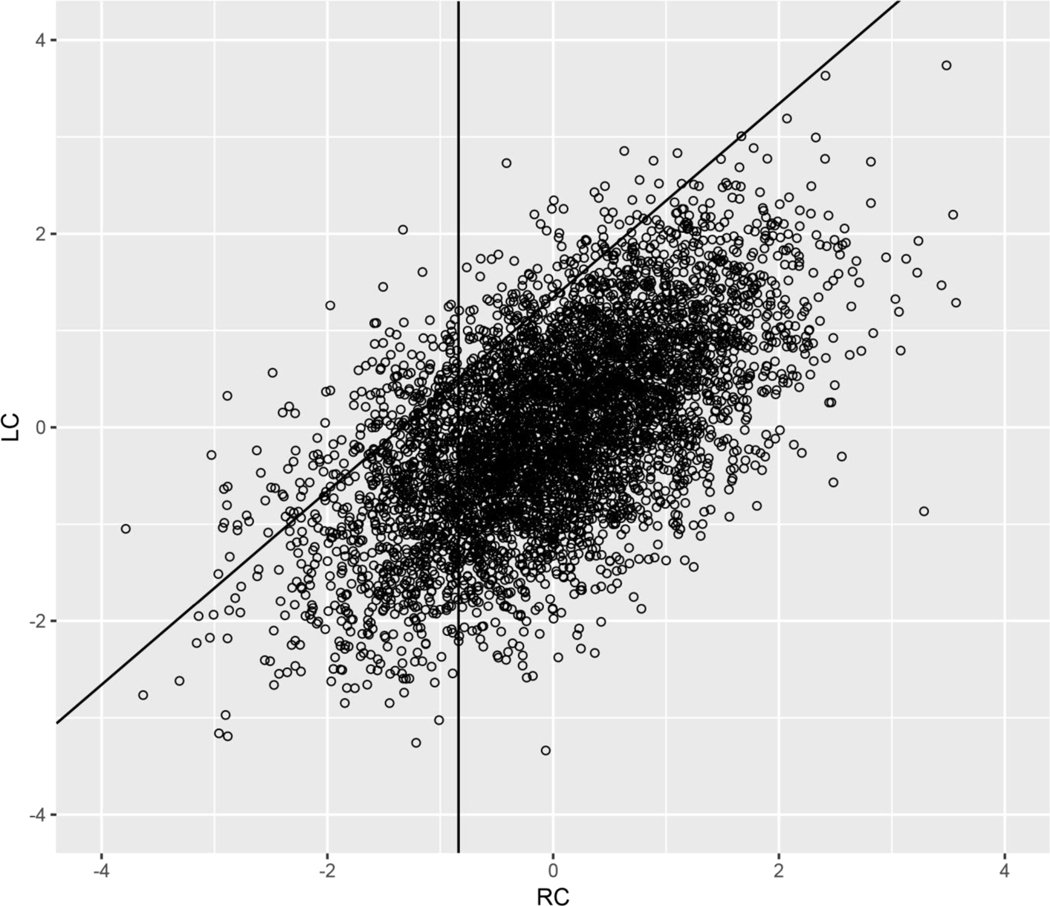
Figure 3.
Scatterplot of listening comprehension and reading comprehension. Points to the left of the vertical line represent scores of poor readers (i.e., the 20th %-ile in RC). Points above the diagonal line represent readers with listening comprehension better than reading comprehension (i.e., at or above 1.5 standard deviations above the mean in LC-RC discrepancy score).

