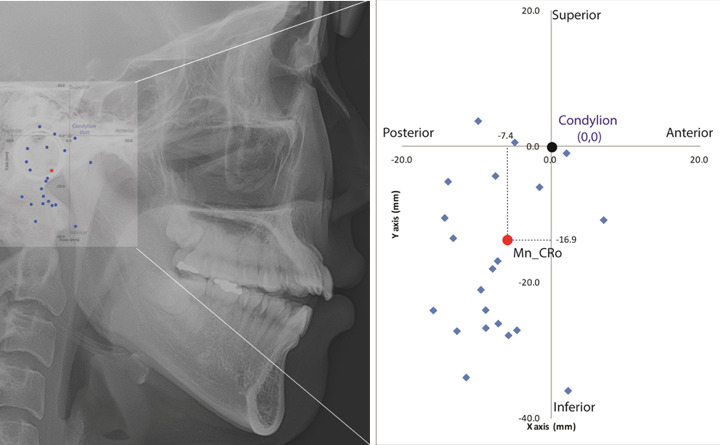
Figure 3.

The center of mandibular autorotation (Mn_CRo) after molar intrusion. Blue “rhombus” dots represent the location of the calculated center of mandibular autorotation for each subject, and the red “round” dot demonstrates the average center of mandibular autorotation for all subjects in this study. Condylion before molar intrusion was set as a reference point (0,0) in the coordinate system.
