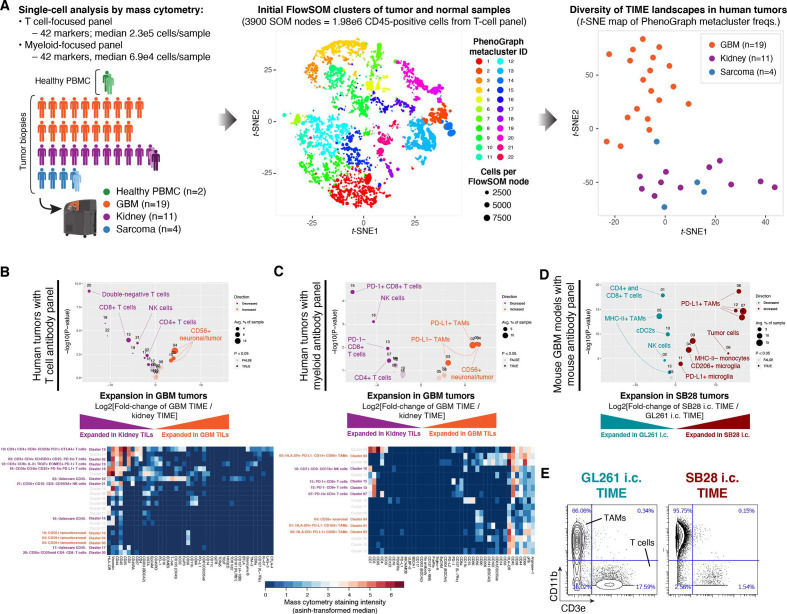
Figure 1.
Abundant PD-L1+ tumor-associated macrophages and lack of MHC-II+ antigen-presenting cells are associated with resistance to dual CTLA-4/PD-1 checkpoint blockade. (A) Immune profiles were obtained from 39 samples: 19 glioblastoma (GBM) primary tumor biopsies, 11 renal cell carcinoma (RCC) primary tumor biopsies (one with paired tumor-adjacent normal tissue and metastatic lesion), 4 sarcoma primary tumor biopsies (one with paired tumor-adjacent normal tissue) and peripheral blood mononuclear cells (PBMC) from one healthy donor (with paired unstimulated and phytohemagglutinin-stimulated aliquots). Single-cell mass cytometry data were acquired using T cell-focused and myeloid-focused antibody panels with 42 markers each (see the Materials and methods section and online supplemental tables S2 and S3). Data were filtered on CD45-positive cells and processed using the PhenoGraph+FlowSOM analysis pipeline to segregate immune cell types into metaclusters and quantify their frequency across samples. To compare the overall tumor immune microenvironment (TIME) landscape across patients, metacluster frequencies for each primary tumor were fed into the t-stochastic neighbor embedding (t-SNE) dimensionality reduction algorithm to produce a map of TIME landscapes, organized spatially by similarity. Data from the T cell panel are shown in all plots; corresponding plots for the myeloid panel are in online supplemental figure S1A, B. (B) Volcano plot comparing abundance of immune cell populations (clusters) in GBM (orange) versus RCC (purple) tumor biopsies stained with the CyTOF human T-cell antibody panel. Statistically significant clusters in volcano plots are highlighted in opaque color and indicated with a cell type label. Diameter of the circle indicates the mean frequency of cells in the sample assigned to that cluster. Heatmap indicates manually annotatedcluster phenotypes and median intensity of antibody staining in each cluster. (C) Volcano plot and heatmap as in (B), stained with the CyTOF human myeloid antibody panel. (D) Volcano plot as in (B) comparing abundance of immune cell populations in mouse GBM models SB28 (red) and GL261 (teal) stained with the CyTOF mouse antibody panel. (E) Biaxial plots of representative raw CyTOF single-cell measurements of CD11b and CD3e on dissociated CD45+ cells from GL261 or SB28 tumors. These represent two of the 42 CyTOF mass cytometry channels, and two of the tumor biopsies, used to produce the volcano plot in (D). The staining patterns typical of tumor-associated macrophages (CD11b+), T-cells (CD3e+), and tumor cells (CD11b− CD3e−) are indicated, but clustering was performed using a total of 38 antibody markers (see online supplemental table S4).

