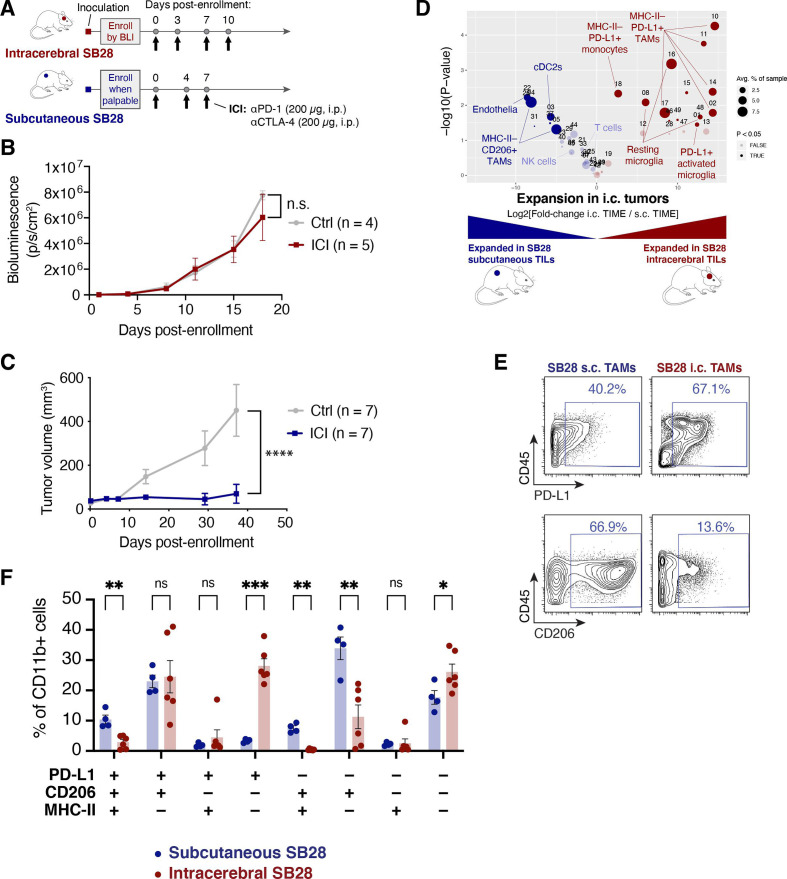
Figure 2.
Subcutaneous SB28 tumors differ from intracerebral tumors in responsiveness to immune checkpoint inhibitor (ICI) treatment and in phenotypes of tumor-associated macrophages (TAMs) in the tumor immune microenvironment (TIME). (A) Schematic illustration of dual CTLA-4/+PD-1 blockade dosing schedule for intracerebral or subcutaneous SB28 tumors. (B) Bioluminescence measurements of SB28 injected intracerebrally and treated with IgG control (gray) or ICI (red). Statistical test: mixed-effects model (n.s.: p>0.05). Error bars: SEM. (C) Tumor volume measurements of SB28 injected subcutaneously and treated with IgG control (gray) or ICI (blue). Statistical test: repeated measures two-wayanalysis of variance (ANOVA; ****p≤0.0001). Error bars: SEM. (D) Volcano plot comparing abundance of tumor-infiltrating leukocyte (TIL) subpopulations in dissociated intracerebral (i.c., red) and subcutaneous (s.c., blue) SB28 tumors using the CyTOF mouse immune cell panel. Statistically significant clusters in volcano plots are highlighted in opaque color and indicated with a cell type label. (E) Biaxial plots of representative raw CyTOF single-cell measurements of CD45, PD-L1, and CD206 on dissociated SB28 subcutaneous or intracerebral tumors. Only CD11b+ events are shown. (F) Mass cytometry data from SB28 subcutaneous or intracerebral tumors were manually gated as shown in (E) on CD11b+ TAMs expressing or lacking PD-L1, CD206, or MHC-II. Frequencies of TAMs expressing all possible permutations of these three markers were quantified. Student’s t-test (***p≤0.001; **p≤0.01; *p≤0.05; n.s.: p>0.05).

