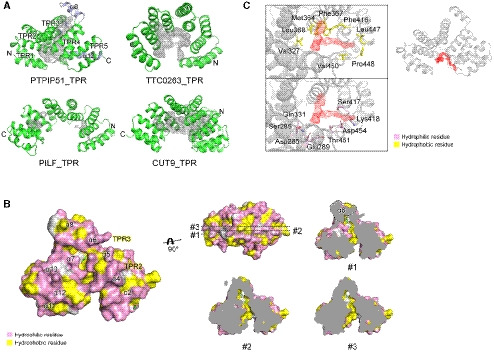
Figure 2. Calculated cavities in the TPR structures and tube‐shaped electron density map in the PTPIP51_TPR structure.

- Cavities of TTC0263_TPR, PILF_TPR, CUT9_TPR, and PTPIP51_TPR. The cavities were calculated as solvent‐accessible regions using the CASTp program.
- The surface properties of the PTPIP51_TPR structure. Hydrophilic and hydrophobic residues are shown in pink and yellow, respectively. Sliced views of PTPIP51_TPR showing the cavity and its hydrophobic property. The α8 helix is highlighted with a dotted line in the sliced view.
- Detailed view of the electron density map indicative of a tube‐shaped molecule. Hydrophilic and hydrophobic amino acid residues adjacent to the electron density map are shown in pink and yellow, respectively. The mFo‐DFc omit maps were generated using the program “phenix.composite_omit_map” in the Phenix program suite. The contour level of the omit map is 0.8 σ.
