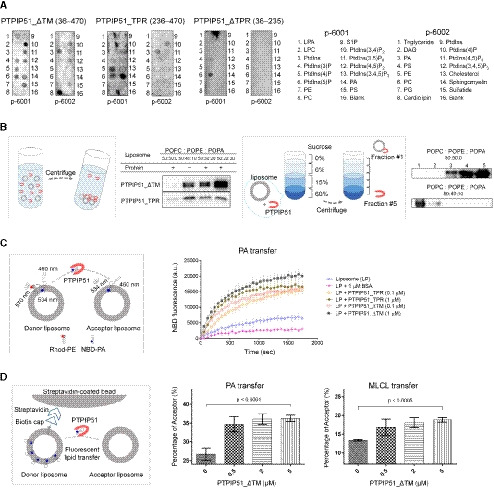
Figure 3. Phospholipid binding and phospholipid transfer functions of PTPIP51.

- PIP strip lipid‐binding assay with recombinant PTPIP51_ΔTM, PTPIP51_TPR, and PTPIP51_ΔTPR.
- PA binding of PTPIP51 (PTPIP51_ΔTM and PTPIP51_TPR) was monitored by a PA precipitation assay and a liposome flotation assay. The POPC:POPE:POPA ratios in each liposome were 50:50:0, 50:40:10, 50:30:20, and 50:20:30. Diagrams of the liposome precipitation and flotation assays are illustrated separately.
- The PA transfer activity of PTPIP51 (PTPIP51_ΔTM and PTPIP51_TPR) was monitored by a FRET‐based lipid transfer assay. A schematic cartoon of the FRET‐based in vitro lipid transfer assay is presented on the left. a.u.: arbitrary unit.
- The alternative bead pulldown‐based lipid transfer assay with PA and MLCL. A schematic cartoon representation of the fluorescent lipid transfer assay is shown on the left. The y‐axes in the graphs show the percentage of acceptor liposome fluorescence calculated using the following formula: 100×F acceptor/(F acceptor+F donor).
Data information: The data are presented as the mean ± SD of technical triplicate (C) or quadruplicate (D) from one representative experiment (n = 2), and P‐values calculated using one‐way ANOVA are shown.
