
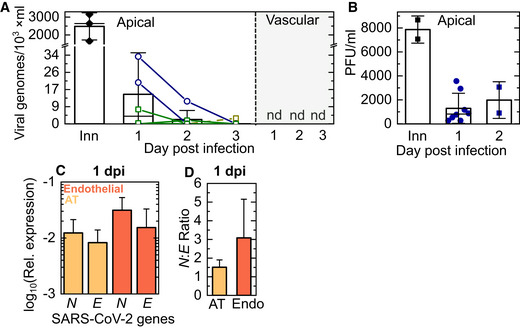
Figure 2. Viral replication but lack of release of infectious virions characterizes SARS‐CoV‐2 infection in the LoC model.
-
A, BThe kinetics of release of SARS‐CoV‐2 progeny was assessed from samples obtained from a wash of the apical face of the chip (A, B), and the vascular effluent (A) collected at each day postinfection. (A) The number of viral genomes in each sample was quantified using a one‐step qRT–PCR assay for the SARS‐CoV‐2 N gene. The starting inoculum introduced to the apical side (labelled “Inn”) corresponded to 200‐300 PFU. Lines join datapoints from the same LoC, reconstituted with (green squares) and without (dark blue circles) macrophages. Viral genome numbers within the apical wash showed a declining trend over 3 days of infection. Viral genomes are not detected (“nd”) in the vascular effluent for all the chips shown. (B) Measurements of plaque‐forming units (PFUs) from the apical wash of LoCs reconstituted without macrophages (n = 8 biological replicates for 1 dpi, n = 2 biological replicates for 2 dpi) confirm the presence of infectious virions.
-
CQuantification of the intracellular levels of transcripts for the SARS‐CoV‐2 N and SARS‐CoV‐2 E genes in the AT and endothelial layers of infected LoCs at 1 dpi (n = 3 biological replicates) relative to expression of the eukaryotic housekeeping gene GAPDH.
-
DSARS‐CoV‐2N: SARS‐CoV‐2 E ratio in the AT and endothelial layers of the infected LoCs shown in (C), n = 3 biological replicates.
Data information: In all plots, the bars represent the mean value, and the error bars represent the standard deviation, the solid black line in (A) represents the median.