
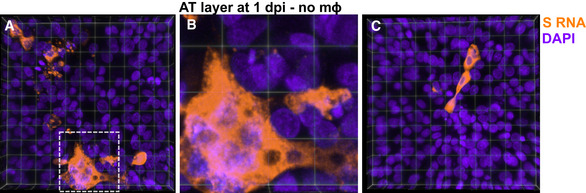
Figure EV4. RNAscope images of highly infected AT cells at 1 dpi.
-
A–C3D views of two representative 232 × 232 µm2 fields of view of the epithelial layer of an LoC reconstituted without macrophages at 1 dpi. S RNA is identified by RNAscope assay and false‐coloured in amber, and nuclear labelling is false‐coloured in indigo. Each field of view shows examples of heavily infected cells. (B) Zoom corresponding to the area marked by the white box in (A), a collection of heavily infected cells is visible together with syncytia formation.