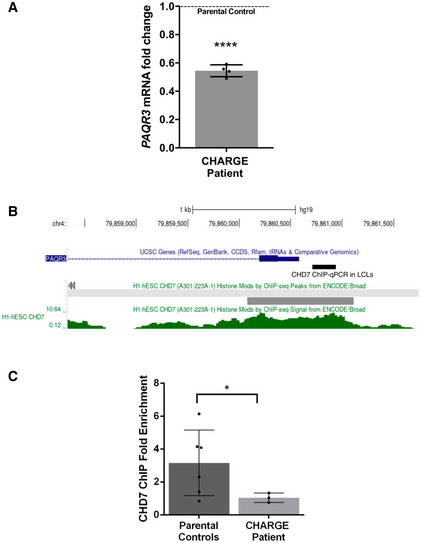
Figure 4. CHD7 regulates PAQR3 expression in human cells.

- qPCR analysis of PAQR3 expression in a CHD7 mutation‐positive patient compared with parental controls set (N = 4; ****P < 0.0001; Student’s t‐test). Fold change was calculated according to the method, using HPRT1 and RPS1 as housekeeping genes for normalization. All data were expressed as mean fold change ± SD across replicates, relative to control parents set to 1 (dotted line). N is the number of experimental repeats.
- Schematic view of PAQR3 exon 1 and proximal promoter on chromosome 4 (hg19 assembly), obtained with the UCSC genome browser (https://genome.ucsc.edu/) and showing the sequence amplified in ChIP‐qPCR assays in LCLs (thick black line) along with a previously described CHD7 ChIP‐seq peak (thick grey line) and signal (green) in H1‐hESC (ENCODE3).
- ChIP‐qPCR assays in LCLs showing decreased occupation of CHD7 on the PAQR3 proximal promoter in a CHD7 mutation‐positive patient (N = 3) compared with parental controls (N = 6); *P < 0.05; Student’s t‐test. All data were expressed as mean fold change ± SD. N is the number of experimental repeats.
