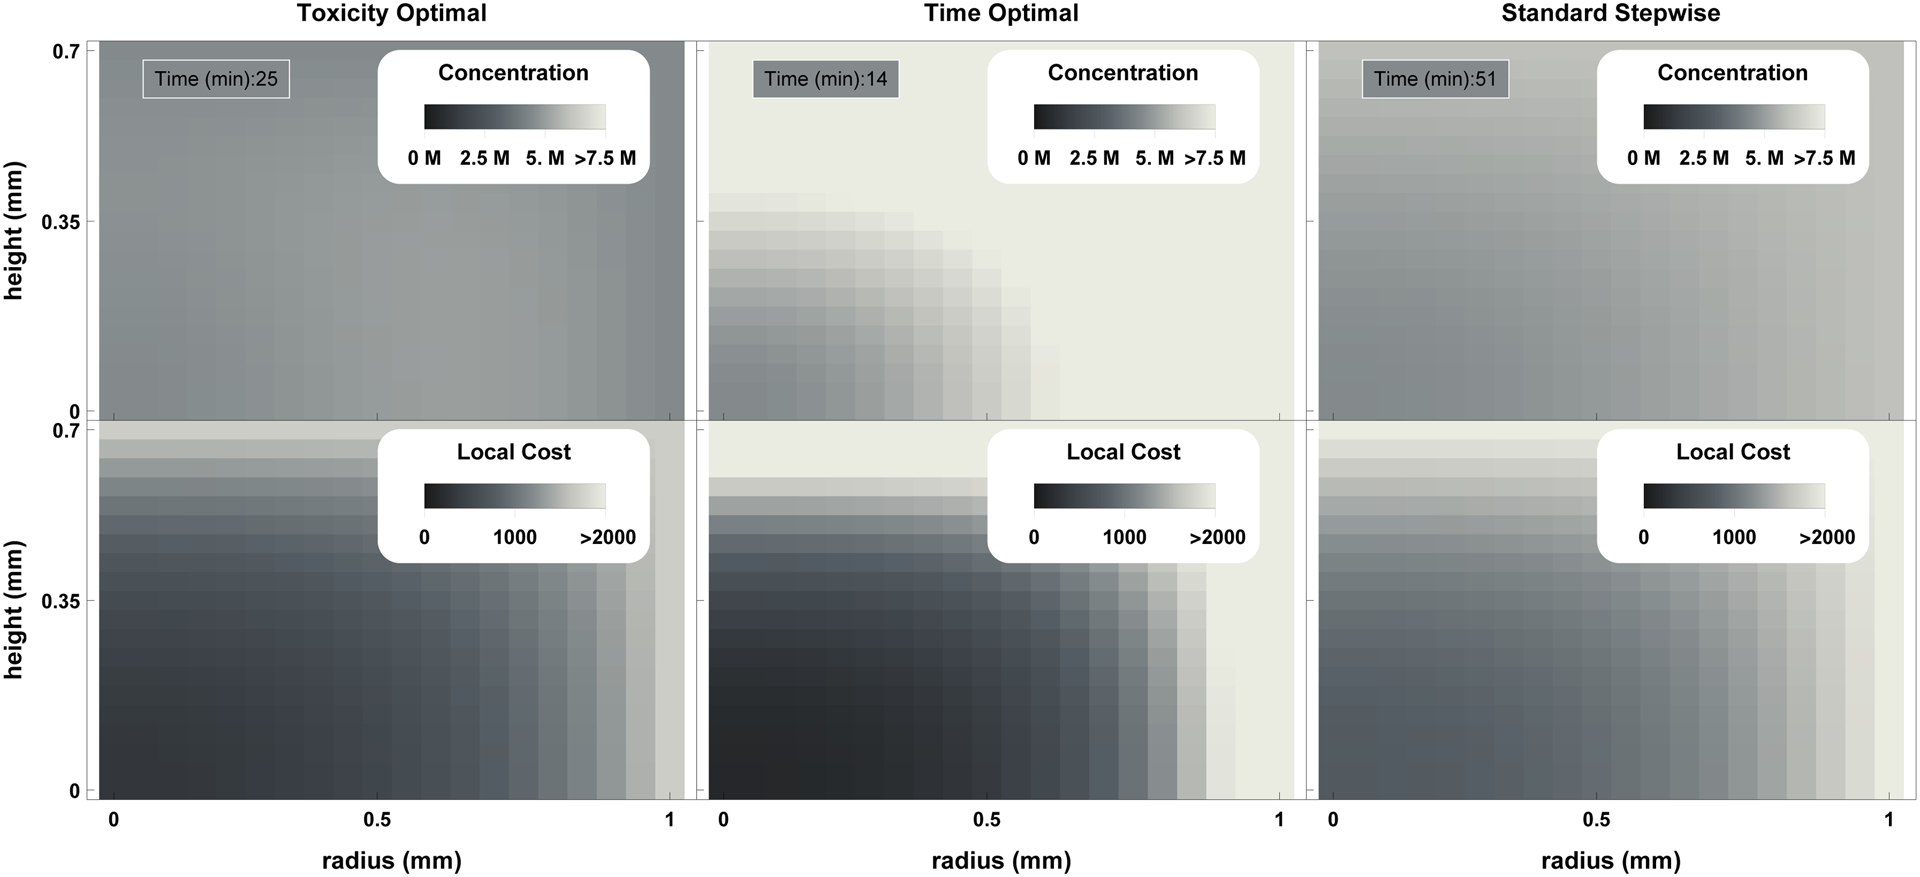
Figure 2.

Plot of final concentration (top row) and accumulated toxicity (with α = 1.6) as a function of location under the toxicity optimal, time optimal, and standard stepwise protocols (left to right). It can be observed that while the toxicity optimal approach has both lower maximal local accumulated toxicity values and a lower mean accumulated toxicity value, more toxicity is accumulated at the center of the tissue. This approach allows the prediction of localized damage due to CPA exposure.
